Weekly Market Momentum
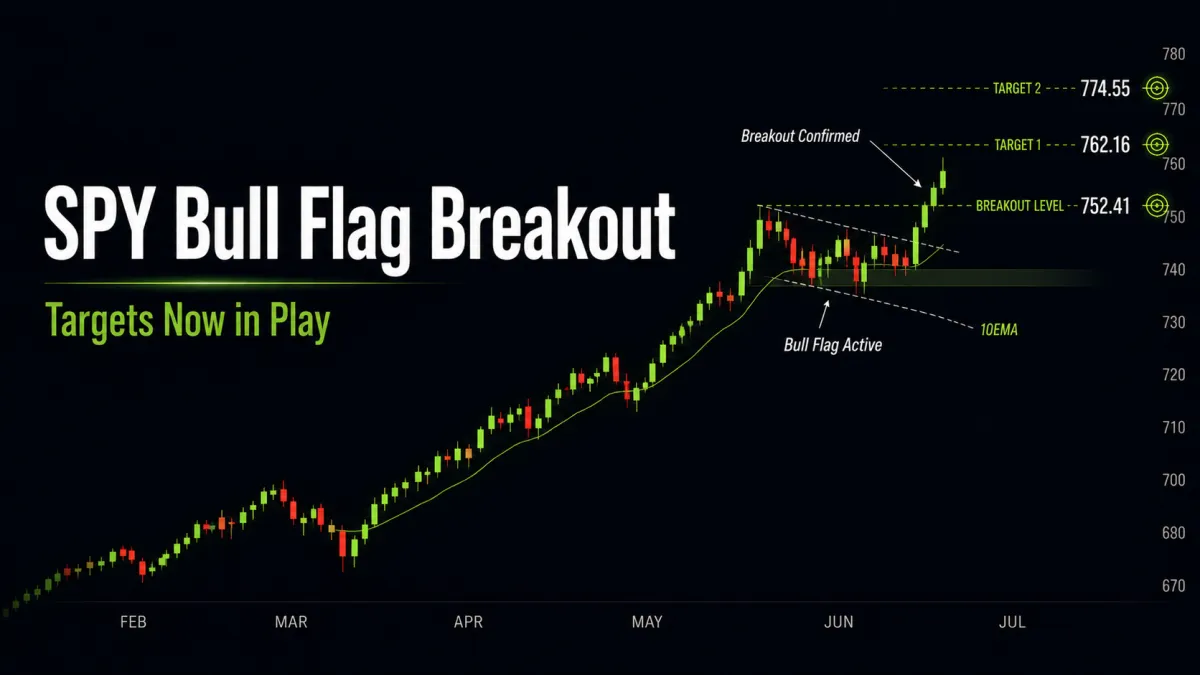
SPY Bull Flag Breakout Confirmed as Upside Targets Come Into View
SPY completed its daily bull flag last week and confirmed continuation with a close above 752.41. As long as price holds above the daily 10EMA, the next upside targets remain 762.16 and 774.55.
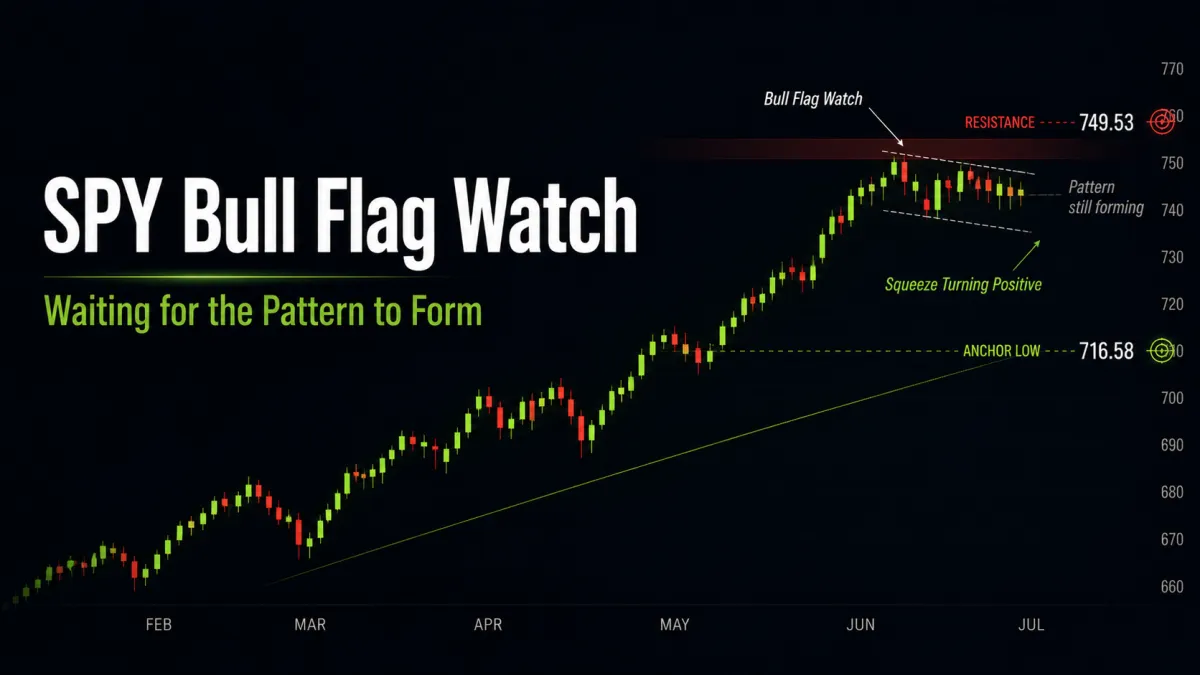
SPY Bull Flag On Watch as Market Coils Beneath Resistance
SPY invalidated its latest bear flag and is now back on bull flag watch from the 6/26 low at 716.58. With the TTM Squeeze flipping positive and price consolidating just below weekly resistance, the market looks increasingly constructive, but the new
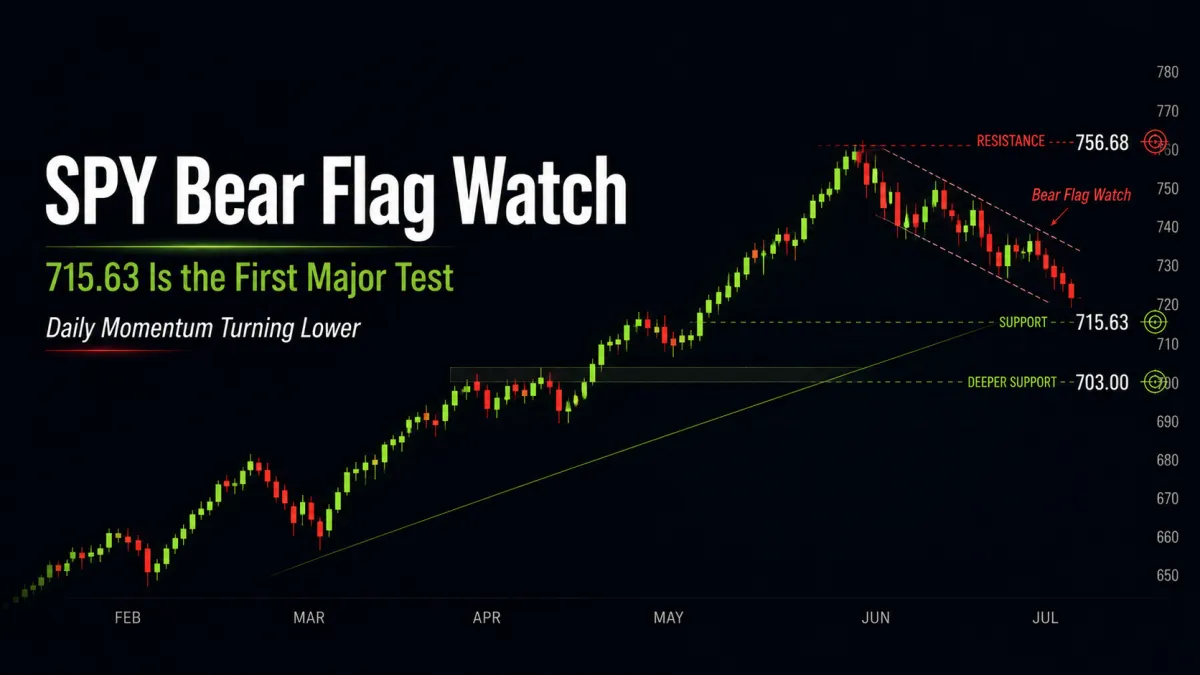
SPY Bear Flag Watch Active as Market Drifts Toward Key Support
SPY’s daily bull flag failed last week after price lost the 10EMA and broke below 735.61, shifting the market into a new bear flag watch from the 6/15 high at 756.68.
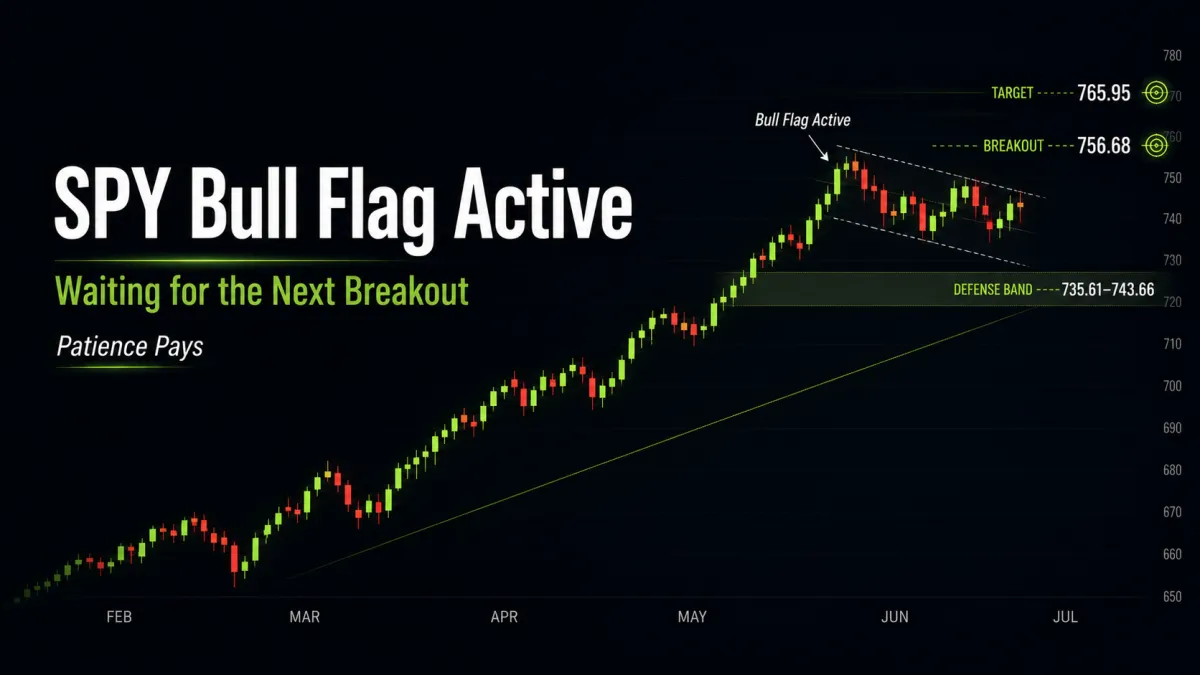
SPY Consolidates Beneath Highs, Bull Flag Still in Play
SPY’s prior bear flag failed and a new bull flag is now active, with 722.59 as the anchor low, 756.68 as the anchor high, and 735.61 to 743.66 as the defense band. The market is now in consolidation, waiting for either a breakout toward 765.95 or a l