Weekly Market Momentum
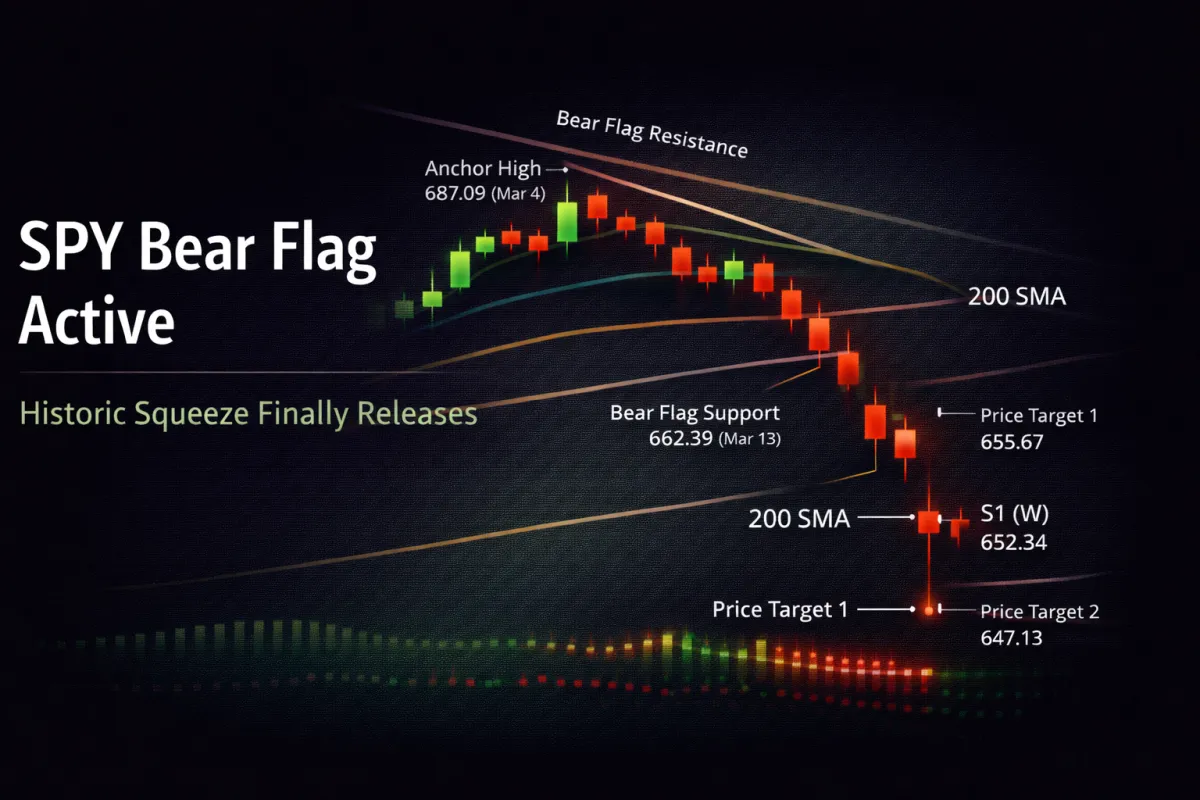
SPY Bear Flag Breaks Support as Decade-Long Squeeze Releases
New Blog Post DescriptionSPY breaks bear flag support at 662.39 as the longest daily volatility squeeze in over a decade finally releases. Downside targets and key support levels now come into focus.
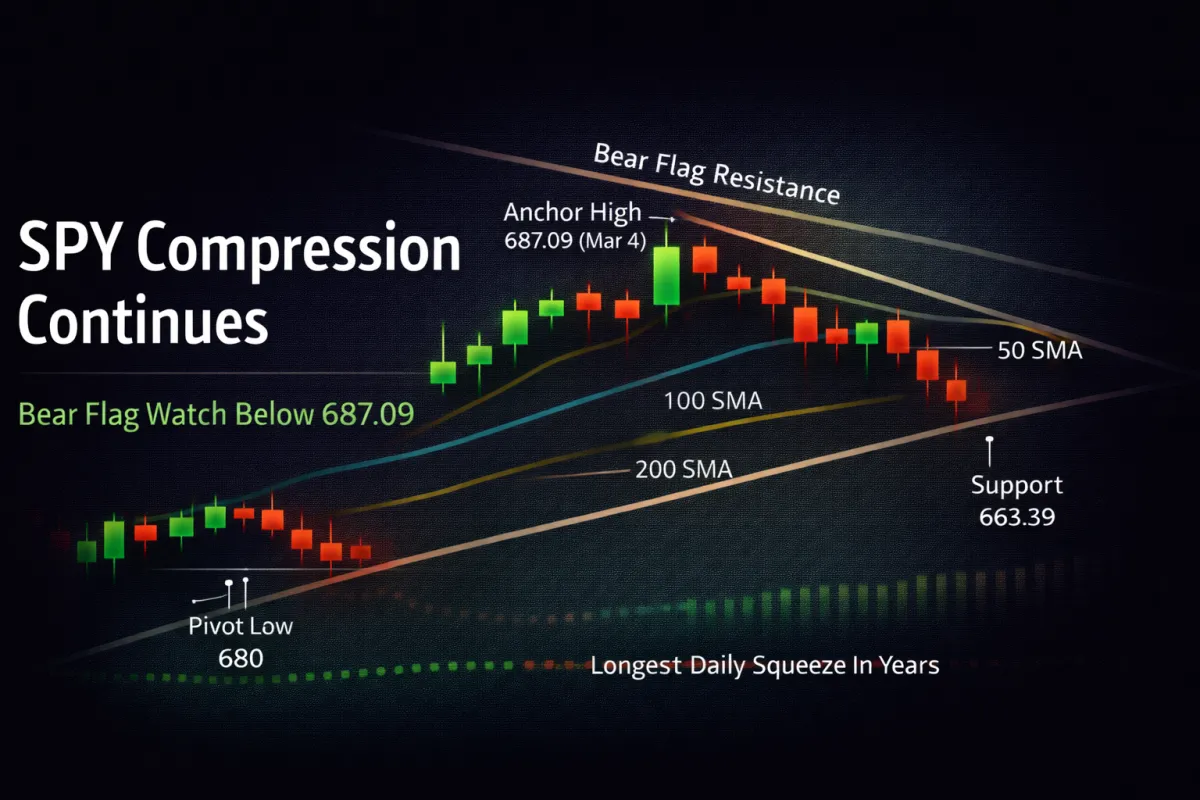
SPY Loses Bull Structure as Historic Squeeze Continues
SPY invalidates another daily pattern as the longest volatility squeeze in years continues. With a new bear flag potentially forming beneath 687.09, downside support levels at 663.39 and the 200SMA are now in focus.
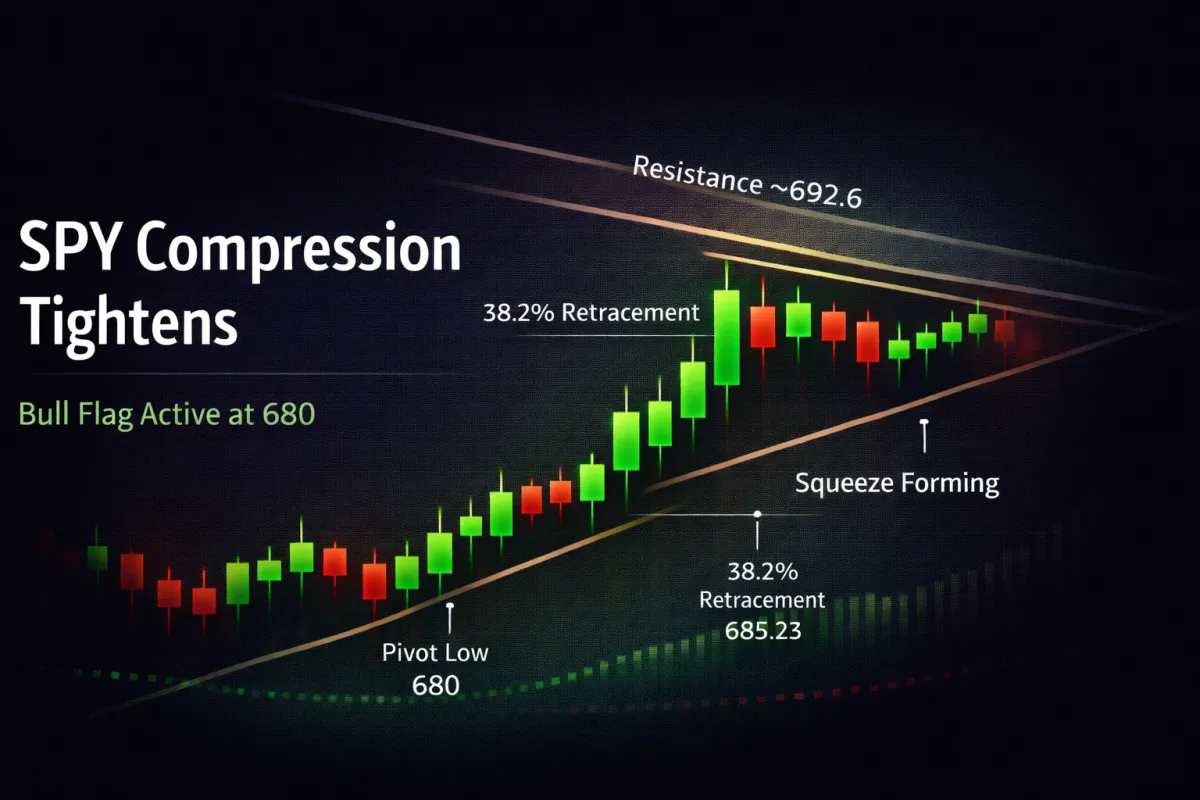
SPY Bull Flag Active at 680 as Multi-Timeframe Squeeze Tightens
SPY forms a new daily bull flag anchored at 680 as both daily and weekly squeezes tighten. With 685.23 as the key pivot and 692.6 resistance overhead, this week could determine whether price breaks out or rolls back toward support.
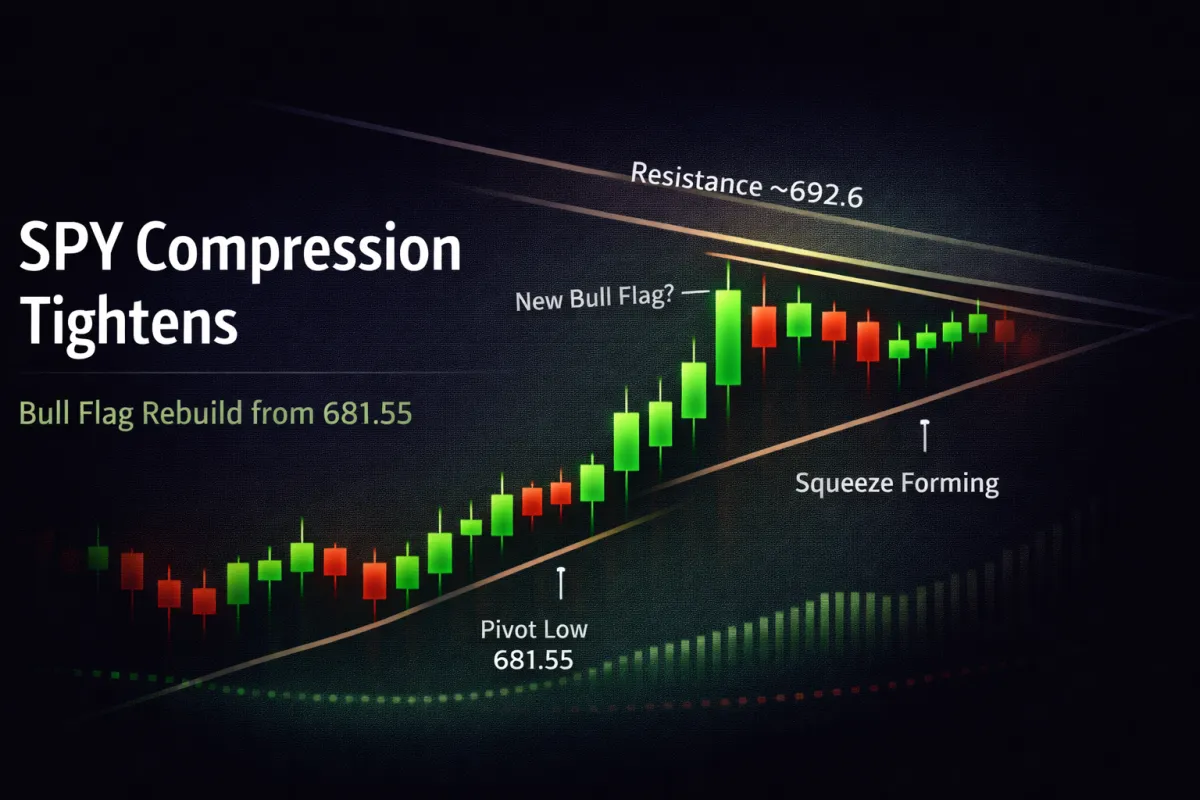
SPY Coiling Again: Bull Flag Rebuild Begins at 681.55
SPY remains trapped in multi-month compression as a new daily bull flag forms above 681.55. With weekly and daily squeezes active, momentum confirmation will determine whether price breaks toward 716.3 or rolls back into range support.