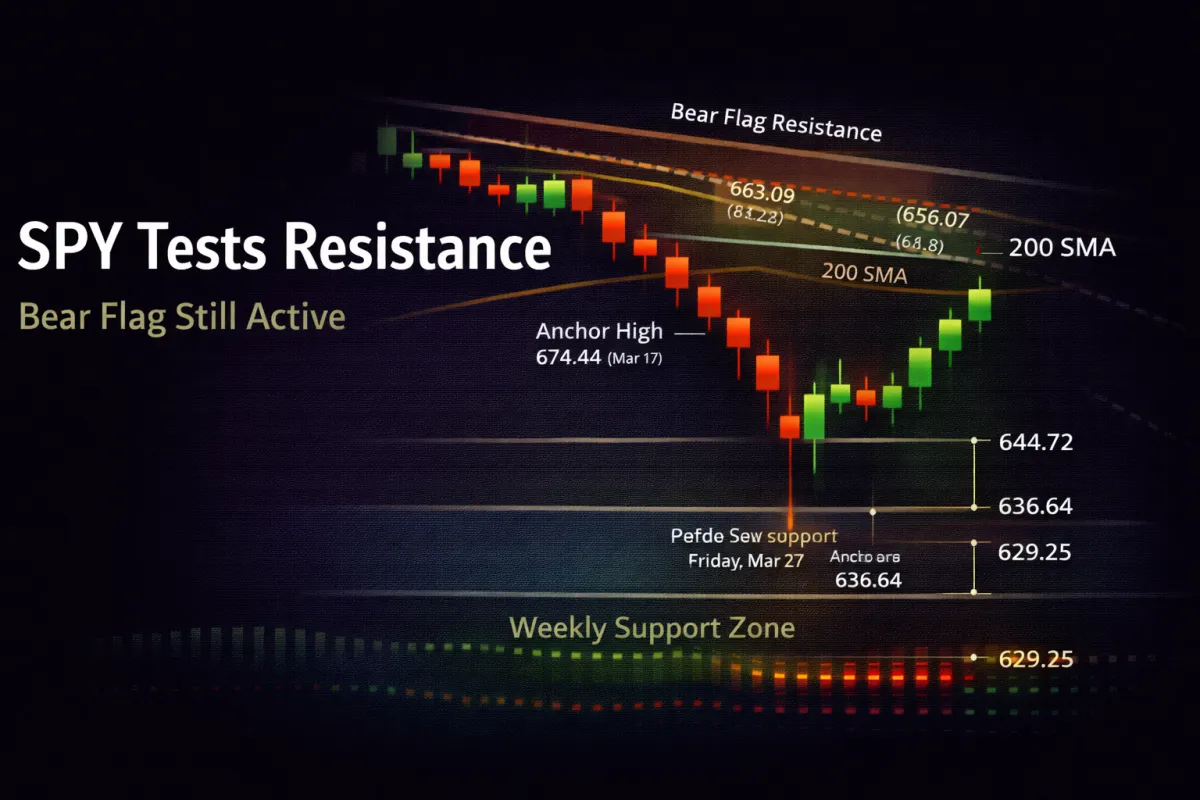
SPY Bear Flag Still Active as Bulls Test Key Resistance

📆 DAILY CHART OUTLOOK — SPY
Week of April 6, 2026
The daily chart is beginning to tell a more nuanced story than it was a week ago.
While the weekly has now entered a major support zone where buyers are expected to begin showing up, the daily has stopped moving straight down and is now testing whether the active bear flag can remain intact or begin to fail.
Last week, price continued lower early, reached the next support area, and then rebounded sharply into the end of the shortened trading week.
That rebound did not invalidate the active bearish structure yet, but it did take the pattern out of continuation mode and shifted the focus to whether bulls can reclaim the key overhead resistance zone this week.
⸻
📌 Pattern State
Pattern State: Bear Flag Active
Pattern Start: 674.44 (3/17 high)
Low Anchor: 644.72 (3/20 low)
Trigger: Friday, 3/27 open and move below 644.72 confirmed downside continuation
⸻
🔄 Structural Sequence (What Happened)
1️⃣ Monday — Support Hit, Buyers Step In
Monday continued the selloff and pushed price down to the next known support level at:
629.28
That was just 3 cents above the weekly 38.2% support at 629.25, where buyers finally stepped in.
That low marked the first meaningful support response after the prior week’s breakdown continuation.
⸻
2️⃣ Tuesday — Strong Rebound, Continuation Pauses
Tuesday markets gapped higher and pushed strongly into the close.
That move reclaimed the 10EMA and officially took the active bear flag out of continuation mode.
Importantly, however, the rally still did not invalidate the broader bear flag structure.
⸻
3️⃣ Wednesday — Rally Stalls at Bear Flag Resistance
Wednesday markets gapped higher again, but the rally ran out of steam as price pushed into the bear flag 61.8% resistance zone.
Price failed there and closed the day back below it.
That kept the bearish structure intact and confirmed that overhead resistance was still controlling the tape.
⸻
4️⃣ Thursday — Gap Lower, Reclaim into the Close
Thursday gapped lower, but buyers again stepped in intraday.
Price reclaimed the 10EMA into the close, but still came up just shy of breaking the 61.8% retracement resistance.
So while bulls showed some life, they still did not reclaim the level that would begin shifting control.
⸻
5️⃣ Friday — No Market Session (Good Friday)
There was no Friday price action this week due to the Good Friday market holiday.
So the week ended with Thursday’s close, leaving price rebounding from Monday’s lows but still beneath the key resistance stack.
That means the market finished the week in a transitional state:
No longer in clean downside continuation
Not yet in bullish reversal
Still beneath the resistance level that matters most
That keeps the active bear flag intact going into this week.
⸻
📐 Immediate Structure Map
The active bear flag is still the controlling structure until proven otherwise.
Key levels now in play:
Resistance Zone
663.09 (38.2%)
200 SMA
10EMA just below
Support
644.72 (pattern support / reactivation level)
636.64 (first target, already tagged)
629.25 (weekly 38.2% support)
As long as price remains below 663.09, the bear flag remains active.
⸻
🔍 Momentum Context
Momentum remains bearish on both the daily and weekly timeframes, even though price has bounced.
• Daily squeeze has already released
• MACD remains bearish
• DMI: DI- > DI+
• ADX remains elevated
• Price is attempting to stabilize, but still beneath major overhead resistance
That means the strongest force in the market is still overhead resistance, not upside trend confirmation.
Any upside continuation from here should still be treated cautiously unless the market can reclaim the key resistance stack cleanly.
⸻
⚠️ Important Structural Note
With the first downside target at 636.64 already tagged, the next key question is whether this rebound is the start of a broader reversal — or just another rally inside the active bear flag.
The level that decides that, for now, is:
663.09 (38.2%)
That level sits right in the same zone as the 200SMA, which makes it the first major area bulls must retake if they want to regain trend control.
If that zone holds as resistance, another pullback is likely.
At a minimum, that would likely mean a retest of the lows.
And if price closes back below 644.72, the bear flag’s downside continuation would be reactivated, and bearish pressure would likely begin expanding again.
⸻
🧭 What Happens Next
Going into this week, the key questions are:
1️⃣ Does Price Reclaim 663.09 / 200SMA?
If bulls can reclaim that resistance zone, then the bear flag begins to lose control and the market can start transitioning into a more constructive recovery attempt.
2️⃣ If Resistance Holds, Does Price Retest the Lows?
If 663.09 and the 200SMA reject again, then another pullback is likely.
That would put the focus back on:
644.72
636.64
629.25
3️⃣ Does a New Structure Form?
If buyers can keep defending support and start producing higher highs and higher lows, then attention shifts toward whether a new bullish pattern can begin forming.
Until that happens, the current active structure remains the only one that matters.
⸻
🎯 Bottom Line
The daily chart is no longer in clean downside continuation, but it is still bearish until proven otherwise.
The active bear flag remains in play.
Price found support near the weekly 38.2% level and bounced, but bulls still have work to do.
The first area they must retake is:
663.09 + the 200SMA
If they cannot, then another leg lower is likely and the bear flag continuation comes back into play.
So for now:
Bears still control the structure
Bulls have started a bounce
Resistance is the key battlefield
That’s what matters most going into this week.
