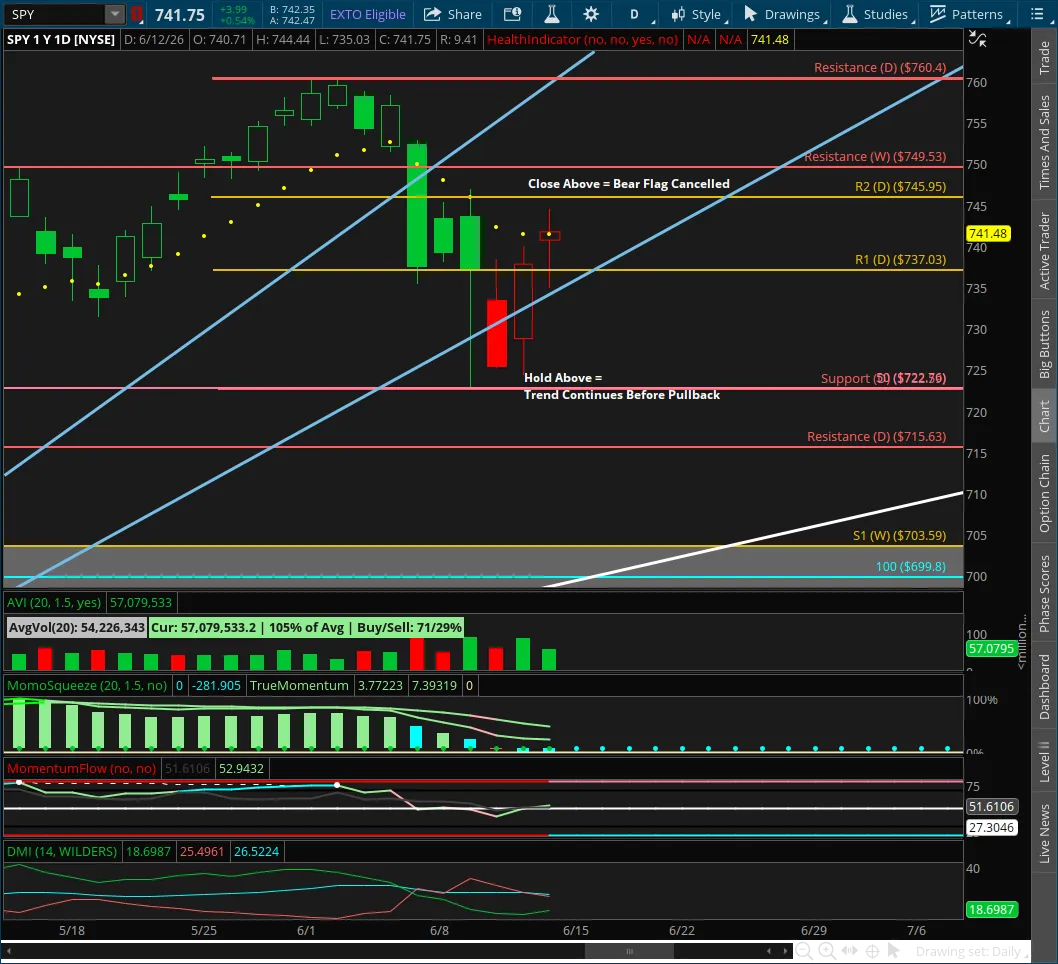
SPY Bear Flag Active as Market Enters Key Decision Zone

📆 DAILY CHART OUTLOOK — SPY
Week of June 15, 2026
The daily chart is now telling the story more clearly.
Last week, the newly forming bear flag finally completed its formation, and price is now sitting in the middle of the consolidation phase with the next directional decision still pending.
That is the key point.
We are no longer just watching a vague pullback. We now have a defined bearish structure to monitor, but it has not confirmed continuation yet.
⸻
📌 Pattern State
Pattern State: Bear Flag Active
Pattern Start: 760.40 (6/2 high)
Anchor Low: 722.59 (6/9 low)
Trigger: Bear flag remains active as long as price stays below 745.95, and continuation is only confirmed if support breaks
⸻
🔄 Structural Sequence (What Happened)
1️⃣ Monday — Inside Bar
Monday printed an inside bar.
That was the first pause after the prior breakdown attempt and kept the developing bearish structure contained without resolving it.
⸻
2️⃣ Tuesday — Outside Sell Candle, Buyers Step In at Lows
Tuesday printed a large outside bar sell candle.
Price sold off hard, but buyers stepped in aggressively off the lows and forced a strong rebound.
That session established the pattern low at 722.59 (6/9).
⸻
3️⃣ Wednesday — Retest of Tuesday’s Wick Holds
Wednesday sold back down into the wick of Tuesday’s candle but held the low.
That mattered because it confirmed buyers were willing to defend that area for now, even while the broader lower-high structure remained intact.
⸻
4️⃣ Thursday — Outside Bar, Buyers Close It Strong
Thursday printed another outside bar, but this time buyers stepped in and forced the close back near the highs.
Price also closed above the first resistance level of what became the newly formed bear flag’s resistance band, even if we did not yet have the full pattern defined at that point.
⸻
5️⃣ Friday — First Higher High and Higher Low, Bear Flag Fully Formed
Friday gave us the first higher high and higher low since the downtrend sequence began.
That completed the bear flag formation.
Price closed:
inside the new bear flag resistance band
above the 10EMA (D)
but still below 745.95
That shows some weakening in the downtrend, but not enough yet to cancel it.
⸻
📐 Immediate Structure Map
The newly formed bear flag is now active.
Key levels now in play:
Resistance Band
737.03
745.95
Support
722.59 (bear flag support / pattern low)
50SMA sitting right on top of that support
below that: 715.63
then 100SMA / weekly support near 703.59
As long as price remains below 745.95, the bear flag remains active and in play.
But no bearish continuation is confirmed until support breaks.
⸻
🔍 Momentum Context
Momentum has cooled from the prior bullish run and the market is now in consolidation.
• The downtrend lost some force late in the week
• Price reclaimed the 10EMA (D)
• But price is still trapped inside the bear flag resistance band
• The next move now depends on whether resistance holds or breaks
This is exactly the type of area where expectations need to stay balanced.
Not too bullish, not too bearish.
Let price resolve the structure first.
⸻
⚠️ Important Structural Note
The most important thing from here is that this bear flag now gives us a clean if/then map.
If price closes below support
A close below 722.59 would break:
bear flag support
the 50SMA
and likely trigger the next leg down
If that happens, price likely rotates toward:
715.63
then potentially the 100SMA / weekly support zone near 703.59
If price closes above 745.95
Then the bear flag breaks.
That would invalidate the bearish structure and likely begin the formation of a new bullish pattern instead.
So this is now a real decision zone, not a place to guess.
⸻
🧭 What Happens Next
Going into this week, the key questions are:
1️⃣ Does Price Stay Below 745.95?
If yes, the bear flag remains active and consolidation continues.
2️⃣ Does Support Break?
If 722.59 / 50SMA fail, then bearish continuation likely begins and the market rotates toward the 715.63 retest zone.
3️⃣ Does Price Break the Bear Flag Instead?
If price closes above 745.95, the bear flag is canceled and the market likely starts building a new bullish structure.
⸻
🎯 Bottom Line
The daily is now in a much cleaner state than it was a week ago.
The new bear flag is formed and active.
760.40 is the anchor high
722.59 is the support low
737.03–745.95 is the resistance band
As long as price remains below 745.95, the bear flag stays in play.
If support breaks, the next leg down likely targets 715.63 and possibly deeper support beyond.
If resistance breaks, the bear flag fails and a new bullish pattern starts forming.
Until something definitive happens, this remains a spot where intraday price action deserves most of the attention, not forcing bigger swing expectations before price resolves the structure.
