SPY Bear Flag Continues Toward Key Weekly Support

📆 DAILY CHART OUTLOOK — SPY
Week of March 30, 2026
The daily chart remains decisively bearish in the short term, even as price now trades deeper into the broader weekly support zone.
Last week we entered with an active bear flag pattern that had already reached both of its initial downside targets.
Instead of reversing, price rebounded just enough to form another bear flag from below the previous pattern’s 161.8% extension, keeping the broader bearish sequence intact.
That new pattern remains the key structure going into this week.
⸻
📌 Pattern State
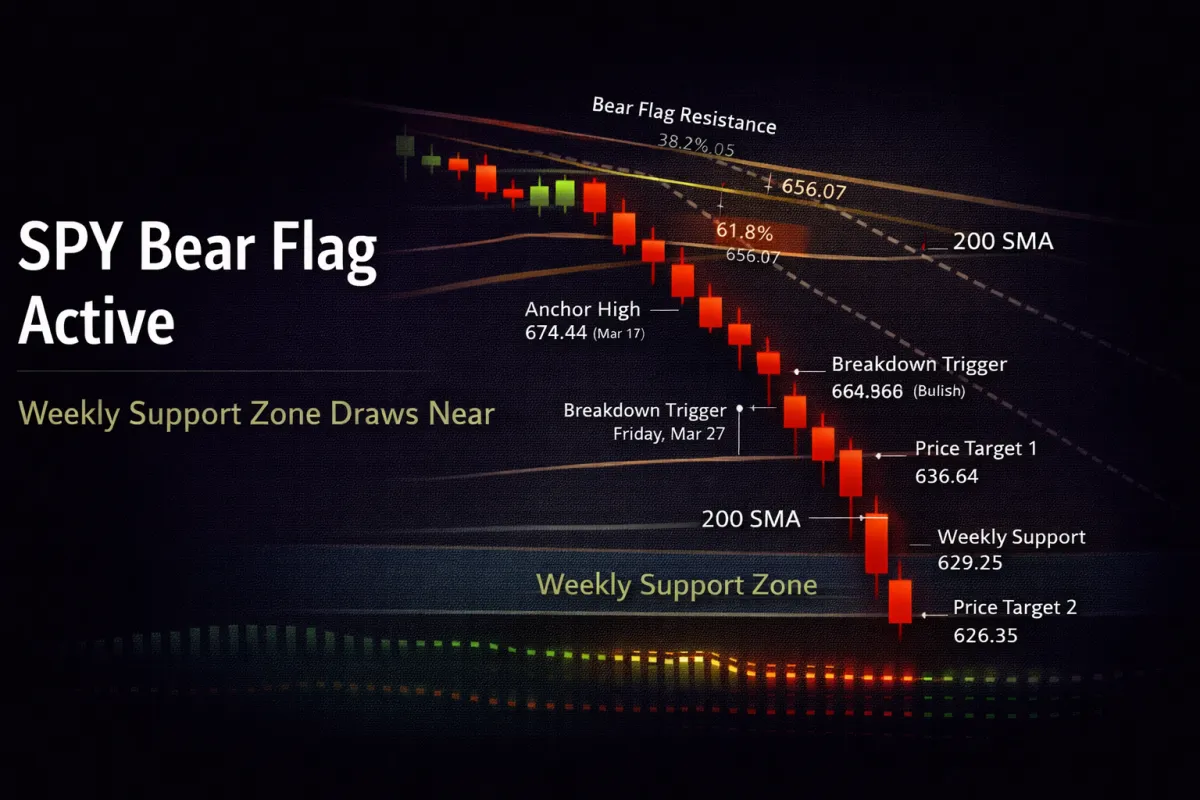
Pattern State: Bear Flag Active
Pattern Start: 674.44 (3/17 high)
Low Anchor: 644.72 (3/20 low)
Trigger: Friday, 3/27 open and move below 644.72 confirmed downside continuation
⸻
🔄 Structural Sequence (What Happened)
1️⃣ Monday — New Bear Flag Confirmed
Monday opened directly into the newly formed bear flag resistance band between:
656.07 (61.8%)
663.09 (38.2%)
Price spent the day battling inside that zone, rejected at the 200SMA, and closed back below the 61.8%, keeping the new bear flag valid and intact.
⸻
2️⃣ Tuesday — Gap Lower, Choppy Follow-Through
Tuesday markets gapped lower, briefly tested the 61.8% level again, and then spent the day chopping.
That action did not invalidate the pattern and kept the bearish structure active.
⸻
3️⃣ Wednesday — Resistance Band Chop
Wednesday gapped above the 61.8% and spent the session chopping inside the bear flag defense band.
Price remained trapped between the 61.8% and 38.2% retracement levels, but failed to reclaim enough ground to invalidate the pattern.
⸻
4️⃣ Thursday — Breakdown Pressure Builds
Thursday markets sold off hard and closed just shy of the official breakdown confirmation level at 644.72, finishing at 644.82.
That left price only 10 cents from confirmation, while momentum, volatility, and Bollinger Bands all expanded in a way that made room for the next leg lower.
⸻
5️⃣ Friday — Breakdown Confirmed, Target 1 Hit
Friday opened below 644.72, confirming downside continuation.
After chopping for much of the morning and giving traders time to find entries, price sold off hard and quickly reached the pattern’s first extension target:
Price Target 1: 636.64
That move confirmed the bear flag remains active and still underway.
⸻
📐 Immediate Structure Map
The active bear flag remains the controlling structure.
Key levels now in play:
Resistance Band
656.07 (61.8%)
663.09 (38.2%)
200 SMA overhead
Support / Targets
636.64 (127.2%, now hit)
629.25 (Weekly support)
626.35 (161.8%, next target)
As long as price remains below the resistance band, the active pattern remains bearish.
⸻
🔍 Momentum Context
Momentum remains firmly aligned with the downside.
• Daily squeeze has already released
• MACD remains bearish
• DMI: DI- > DI+
• ADX continues rising
• RSI is now becoming deeply oversold
One important nuance:
Last week, RSI made bearish divergence with price making lower lows and RSI making lower lows as well.
That suggests lower prices are still likely ahead, even if momentum may not be strong enough to sustain a large move much further without first producing a bounce.
That opens the door to a bottoming process beginning soon, but not necessarily immediately.
⸻
⚠️ Important Structural Note
Price is now repeatedly rejecting at the 200SMA.
Also:
The 50SMA has crossed below the 100SMA
Both are now trending lower
The longer price remains down here, the more likely the 50SMA continues falling toward the 200SMA.
If the 50SMA crosses below the 200SMA, that would strongly increase the odds that:
More 52-week lows are ahead
A deeper retracement into the monthly support zone becomes more likely
The eventual bottom takes longer to form
So while support is nearby, the larger moving-average structure is beginning to deteriorate.
⸻
🧭 What Happens Next
Going into this week, the key questions are:
1️⃣ Do We Reach the Next Target Before We Bounce?
The next target remains:
626.35 (161.8%)
If price reaches that level first, then attention shifts to how the next bounce behaves.
2️⃣ What Kind of Pattern Forms After the Bounce?
After the next bounce, we will need to determine whether the new structure is:
Validated → lower prices remain likely and rallies should be expected to get sold into
Invalidated → lower prices are still possible, but the market may begin transitioning into a bottoming process
3️⃣ If the New Pattern Fails, Is a Base Beginning?
If the next bearish structure fails, that is where we start watching for a more classic bottoming environment:
rallies get sold into
selloffs get bought near lows
choppy two-sided action begins forming a floor
⸻
🎯 Bottom Line
The current bear flag remains active and in control.
Price has already hit the first target at 636.64, and the next major level below remains 626.35.
Bears remain in control for now.
Volatility is high, VIX is elevated, and options premiums are inflated. This is not an environment to rush into trades unless signals are high confidence.
That means:
Long options should be used carefully
Stops are wider
Premiums are already pricing in much of the move
Whipsaws are likely in both directions
This is a much better environment for:
selective intraday trading
patience
and, for the right traders, selling far OTM puts on assets you’d genuinely be willing to own
Going into the week, the focus remains on:
the active bear flag
whether it reaches 626.35
and what structure forms after that move
That next pattern will tell us whether the market is preparing for another leg down, or beginning the slow process of building a bottom.
