SPY Bear Flag Breaks Support as Decade-Long Squeeze Releases

📆 DAILY CHART OUTLOOK — SPY
Week of March 16, 2026
The daily chart is now telling a very different story than the weekly.
While the weekly still reflects a broader healthy pullback inside an ongoing bull trend, the daily timeframe has turned decisively bearish in the short term.
For months we have watched patterns repeatedly form and invalidate as volatility compressed.
Last week was the first time a structure formed, held, and then broke support, signaling that downside momentum may finally be expanding as the long-running squeeze begins to release.
⸻
📌 Pattern State
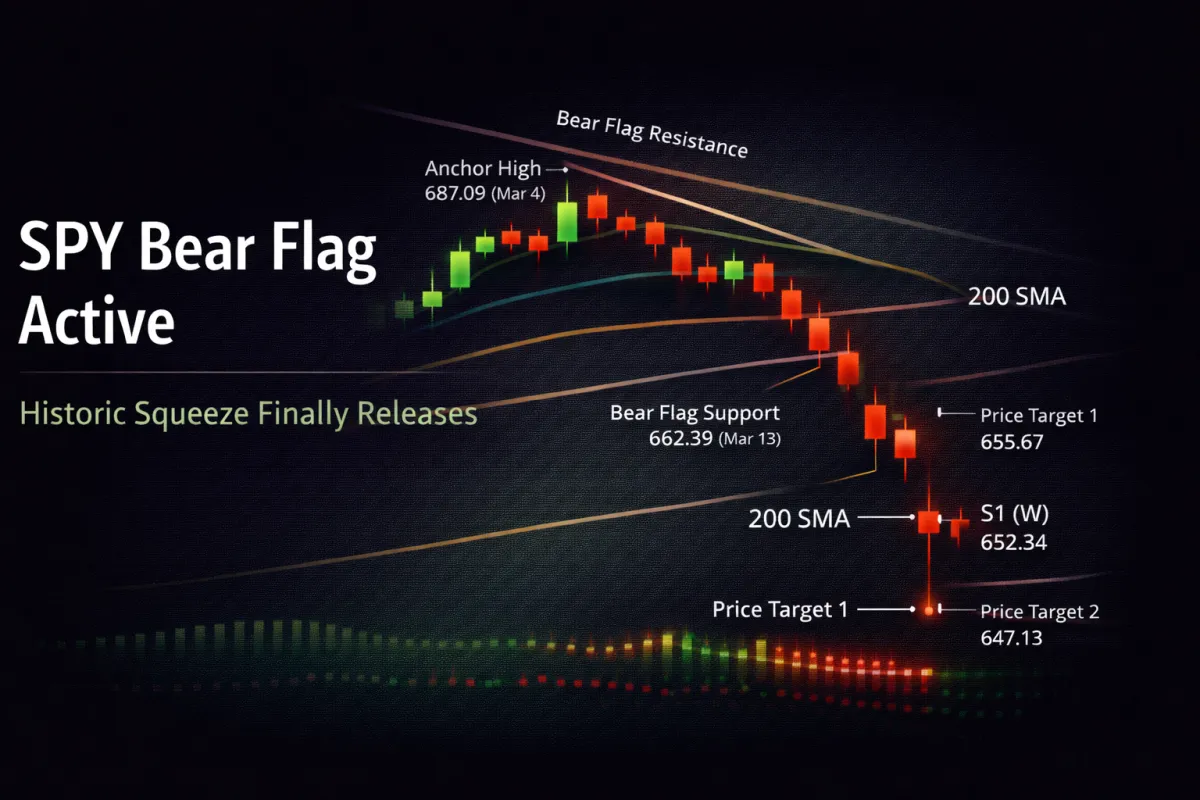
Pattern State: Bear Flag Active
Pattern Start: 687.09 (3/4 high)
Low Anchor: 662.39 (3/13 low)
Trigger: Close below 662.39 confirmed downside continuation
⸻
🔄 Structural Sequence (What Happened)
1️⃣ Monday — Pattern Formation Continues
Monday opened lower and rebounded intraday.
That bounce kept the developing bear flag in formation mode, while price printed another lower low within the structure, reinforcing the bearish sequence.
⸻
2️⃣ Tuesday — Bear Flag Established
Tuesday opened flat and rallied into the 100SMA, where price was rejected.
That day produced the first higher high and higher low within the developing structure, officially establishing the bear flag.
Importantly, the close remained below the 38.2% retracement, which kept the bearish pattern valid.
⸻
3️⃣ Wednesday — Resistance Zone Chop
Wednesday traded primarily within the bear flag’s resistance zone between the 38.2% and 61.8% retracement levels.
Price failed to reclaim resistance, leaving the pattern structure intact.
⸻
4️⃣ Thursday — Momentum Turns Down
Thursday opened with a gap lower, and bearish momentum began expanding again.
The move lower reinforced the developing bear flag and pushed price back toward support.
⸻
5️⃣ Friday — Bear Flag Breakdown
Friday continued the selloff and closed below pattern support at 662.39, confirming downside continuation.
This break occurred as the daily squeeze released for the first time in over 30 days, marking the end of the longest daily volatility compression in more than a decade.
With support broken and volatility expanding, downside targets are now in play.
⸻
📐 Immediate Structure Map
With the bear flag now active and support broken, the market is likely to rotate toward the next structural levels below.
Key levels to watch:
200 SMA
Price Target 1: 655.67
S1 (W): 652.34
Price Target 2: 647.13
These levels also begin to align with the larger weekly support zone between 652.34 and 629.25, which we discussed in the higher timeframe analysis.
⸻
🔍 Momentum Context
Momentum indicators have now shifted firmly in favor of the bears.
• Daily squeeze released after more than 30 days of compression
• MACD momentum expanding to the downside
• DMI: DI- > DI+
• ADX beginning to rise
This shift in momentum suggests the current move may carry further before a meaningful bounce develops.
⸻
⚠️ Important Structural Note
Despite the bearish breakdown, there is one level that has repeatedly supported this entire uptrend:
The 200 SMA.
Price has not lost the 200SMA since the 2025 trend began.
Because of that, the 200SMA may create significant friction if price approaches it.
Unless the market gaps below the 200SMA, it could slow or temporarily stall the downside move before price reaches deeper targets.
However, if price opens below the 200SMA, the move toward the weekly support zone could accelerate quickly.
⸻
🧭 What Happens Next
If bearish momentum continues expanding, price will likely rotate toward the weekly support zone between 652.34 and 629.25.
Once price approaches that region, attention will shift toward buyer behavior.
Key things to watch at support:
• Price opening outside Bollinger Bands
• Intraday reversal attempts
• A bounce establishing new resistance and the next pattern
That process will determine whether the market begins building a new base or continues rotating lower.
⸻
🎯 Bottom Line
After months of volatility compression and repeated pattern failures, the market has finally produced a structure that held and broke.
The bear flag is now active, with downside targets in play following Friday’s close below 662.39.
Short-term momentum favors the bears.
But the next major test will come near the 200SMA and weekly support zone, where buyers are likely to begin stepping back into the market.
