SPY Bear Flag Continues as Price Reaches Major Support Zone

📆 DAILY CHART OUTLOOK — SPY
Week of March 23, 2026
The daily chart is continuing the bearish expansion we outlined last week.
While the weekly has now reached a major long-term support zone where buyers are expected to begin stepping in, the daily timeframe remains decisively bearish and is still following through on the active breakdown.
Last Sunday we noted that support had already broken and the bear flag had become active.
This week confirmed that view.
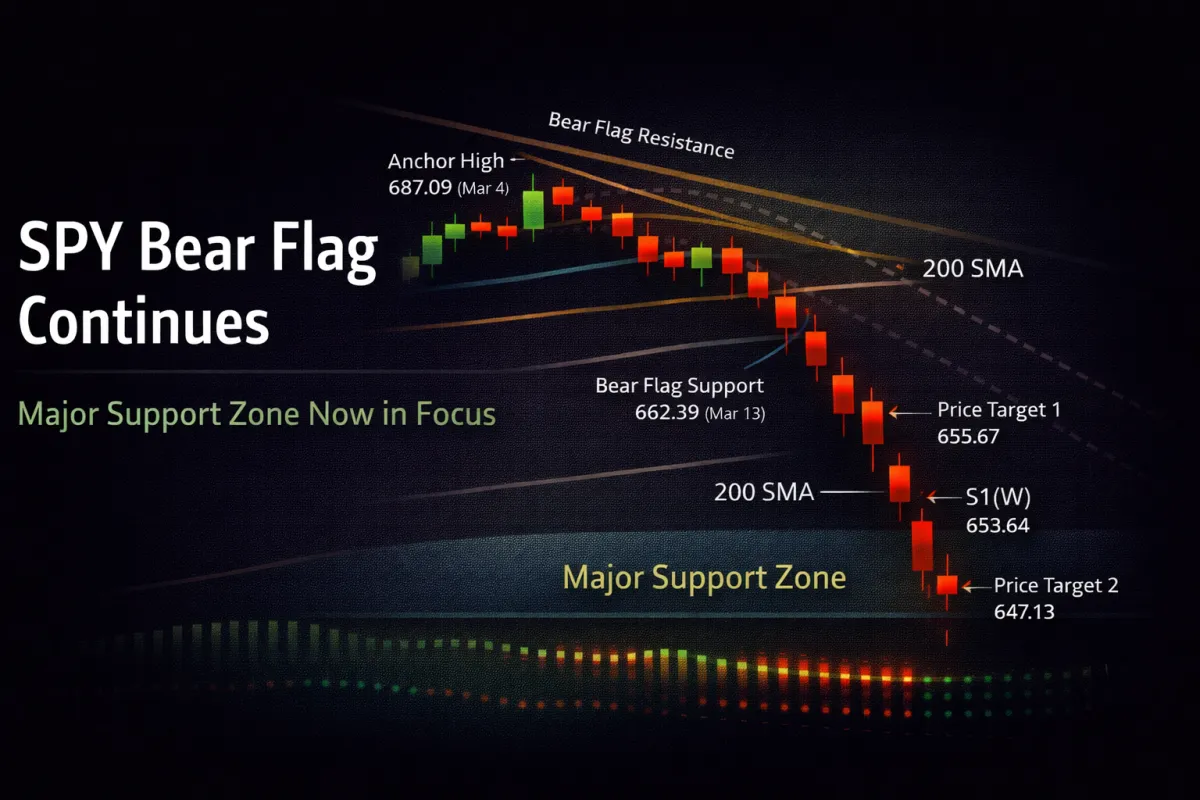
Price respected resistance early in the week, rolled back over, lost the 200SMA, and continued lower to both downside targets.
⸻
📌 Pattern State
Pattern State: Bear Flag Active
Pattern Start: 687.09 (3/4 high)
Low Anchor: 662.39 (3/13 low)
Trigger: Close below 662.39 confirmed downside continuation
⸻
🔄 Structural Sequence (What Happened)
1️⃣ Monday — Bounce Inside the Breakdown
Monday opened higher and traded back inside Friday’s range.
That bounce did not invalidate the active bear flag.
It was simply an inside-range rebound after the prior week’s support break.
⸻
2️⃣ Tuesday — Resistance Hit, Sellers Return
Tuesday again opened higher, but price rallied into bear flag support turned resistance at 671.83, where sellers stepped in.
That rejection got the downtrend moving again and preserved the active bearish structure.
⸻
3️⃣ Wednesday — Support Lost Again
Wednesday continued the selloff and closed back below 662.39 support.
That kept the bear flag fully active and confirmed that downside momentum remained in control.
⸻
4️⃣ Thursday — 200SMA Break + First Target Hit
Thursday opened with a gap lower, below the 200SMA, and price moved quickly to the first downside target at:
655.67
Although buyers stepped in intraday and forced a rebound, the broader bearish momentum remained intact.
⸻
5️⃣ Friday — Trend Support Lost, Second Target Hit
Friday continued the selloff.
Price lost the weekly fib fan trend line and accelerated lower into the second swing target at:
647.13
That move confirms the bear flag remains active and still underway.
⸻
📐 Immediate Structure Map
The active bear flag from last week remains the controlling structure.
Key levels now in play:
Resistance Zone
662.39
671.83
200 SMA
Next Support
629.25 (Weekly)
As long as price remains below the reclaimed support / resistance stack, the active pattern remains bearish.
⸻
🔍 Momentum Context
Momentum remains firmly aligned with the downside.
• Daily squeeze has already released
• MACD remains bearish
• DMI: DI- > DI+
• ADX rising
• Price now trading below the 200SMA
This is not the time to fight the market.
The trend remains down until price proves otherwise.
⸻
⚠️ Important Structural Note
Even though price has now reached the long-term support region on the weekly, the daily chart has not yet produced a reversal pattern.
That means:
No higher high
No higher low
No new base
No confirmed buyer control
Until that changes, the current active structure is still the same bear flag from last week.
Any bounce from here must first prove itself through higher highs and higher lows before it can be treated as anything more than a countertrend rally.
⸻
🧭 What Happens Next
As long as the active bear flag remains in control, the next major level below is:
629.25 (Weekly Support)
From here, we need to watch for one of two things:
• Continued lower highs and lower lows → bearish continuation remains active
• A shift to higher highs and higher lows → signals that buyers may be trying to build the next pattern
Until that shift happens, the current pattern remains the only one that matters.
⸻
🎯 Bottom Line
The bear flag triggered last week and continued cleanly this week.
Price rejected resistance, lost the 200SMA, broke the weekly fib fan trend line, and reached both downside targets.
The active pattern is still underway.
Right now is the best time to remember:
The trend is your friend.
Don’t fight the market.
Price is always right.
There is no need to rush into anything new in the middle of a selloff unless clear reversal signs appear.
For now, the focus remains on:
The active bear flag
The next support at 629.25
Watching for the first true evidence of a new structure to form
