SPY Loses Bull Structure as Historic Squeeze Continues

📆 DAILY CHART OUTLOOK — SPY
Week of March 9, 2026
The daily chart continues to rotate through pattern formation and invalidation inside a larger compression regime.
Last week again demonstrated the behavior we have been seeing for months: patterns forming, then failing quickly as the market remains trapped in volatility compression.
By the end of the week, no active pattern remains, and we are once again watching for the formation of a new structure.
Pattern State: Bear Flag Watch
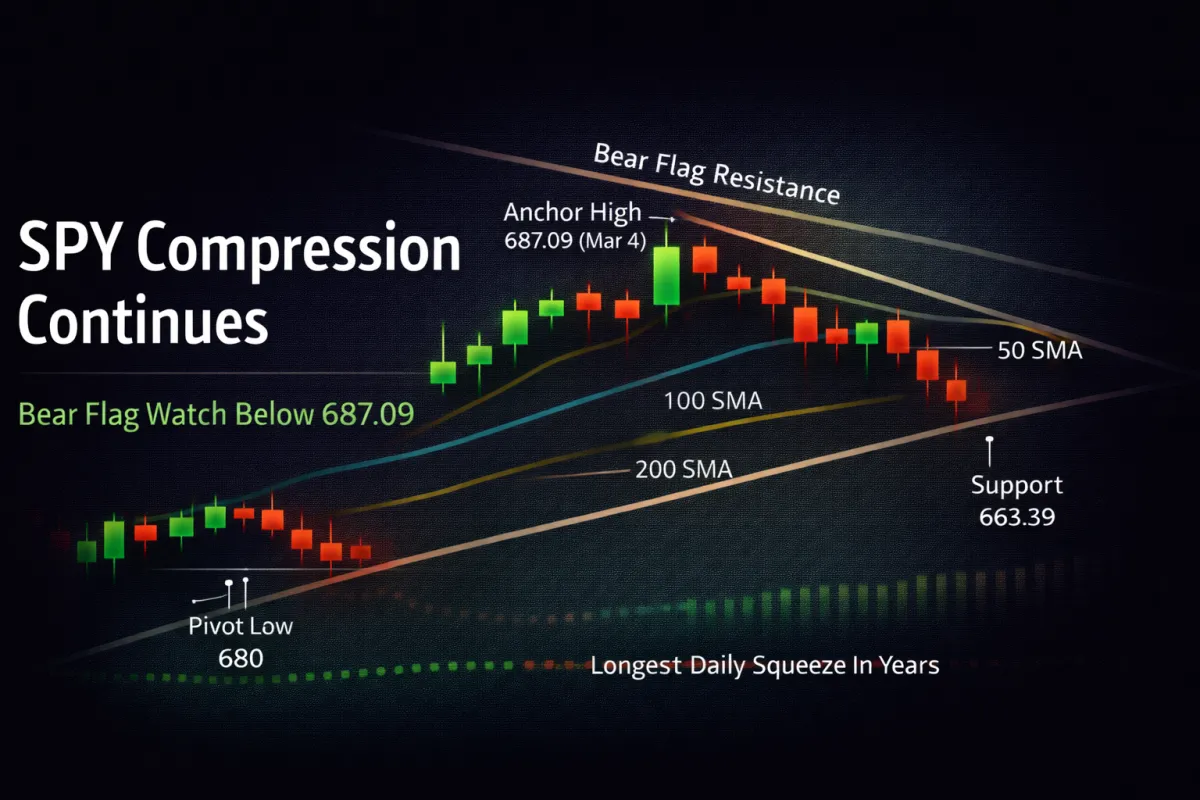
Anchor High: 687.09 (3/4)
🔄 Structural Sequence (What Happened)
1️⃣ Tuesday — Bull Flag Invalidated
Coming into the week, the previously established daily bull flag remained active.
However, Tuesday produced a lower high and lower low, and price closed below the 38.2% retracement, invalidating the structure.
That immediately ended the bull flag and opened the door for a bearish structure to begin forming.
2️⃣ Wednesday — Bear Flag Forms and Fails
Following Tuesday’s breakdown, price began forming a new bear flag.
However, that pattern did not last long.
Wednesday’s rally pushed price back above the bear flag’s 38.2% retracement, invalidating the pattern the same day it formed.
This continued the ongoing pattern reset behavior we have seen throughout the compression.
3️⃣ Thursday — New Bull Flag Established
After Wednesday’s rally, price established a new bull flag.
The structure formed when Thursday’s candle:
Printed a lower high and lower low
Closed above the 38.2% retracement
That sequence officially validated the new bullish pattern.
4️⃣ Friday — Bull Flag Invalidated
Friday immediately erased that structure.
Price opened sharply lower and sold off to bull flag support at 669.66.
Although buyers stepped in briefly and pushed price back toward the 38.2% retracement, the bounce failed and price sold off again into the close.
That move invalidated the bull flag, removing the last active pattern.
📌 Current Pattern State
Active Pattern: None
The next structure to watch is a potential bear flag.
The anchor high for that potential bear flag is now:
Wednesday’s high (March 4) at 687.09 — the high of the most recent completed pattern structure.
For a bear flag to develop from here, price must continue printing:
Lower highs
Lower lows
As long as that sequence continues, the bear flag structure will continue building.
📐 Immediate Structure Map
Key downside levels to watch:
Last Week’s Low
663.39
200 SMA
A clean break below last week’s low would likely trigger continuation toward those downside support levels.
🔍 Momentum Context
Momentum indicators currently favor the downside.
Price trading below 50 SMA and 100 SMA
MACD below zero
DI- > DI+
ADX beginning to rise
If ADX continues rising while DI- leads, downside momentum could strengthen quickly.
⚠️ Important Context: The Longest Daily Squeeze in a Decade
This constant cycle of pattern formation and invalidation is not random.
The daily chart has now been in a volatility squeeze for roughly a month, which is one of the longest squeezes observed on the daily timeframe in nearly a decade.
When volatility compresses for this long, markets typically exhibit:
Frequent pattern resets
False breakouts
Rapid reversals
Choppy rotational price action
Until the squeeze releases, this behavior can continue.
🧭 What Matters This Week
🔴 Bearish Continuation
If price:
Breaks last week’s low
Continues printing lower highs and lower lows
Then the developing bear flag continues building and downside targets become likely.
🟡 Bounce Scenario
If price rallies early in the week:
As long as price remains below the 50 / 100 SMA zone, rallies into that region are more likely to be met with resistance.
Those moves may simply form the next lower high of the developing bear flag.
🎯 Bottom Line
We are currently:
Outside any confirmed pattern
Watching for a new bear flag formation
Trading below key moving averages
Inside one of the longest daily squeezes in years
Until volatility expands and a clean structure develops, the safest approach remains intraday focus and patience while the next pattern forms.
Let the market rebuild structure first.
Then trade the pattern.
