Alternative: SPY Breaks Out to New Highs, Now Watching for the First Bull Flag

📆 DAILY CHART OUTLOOK — SPY
Week of April 20, 2026
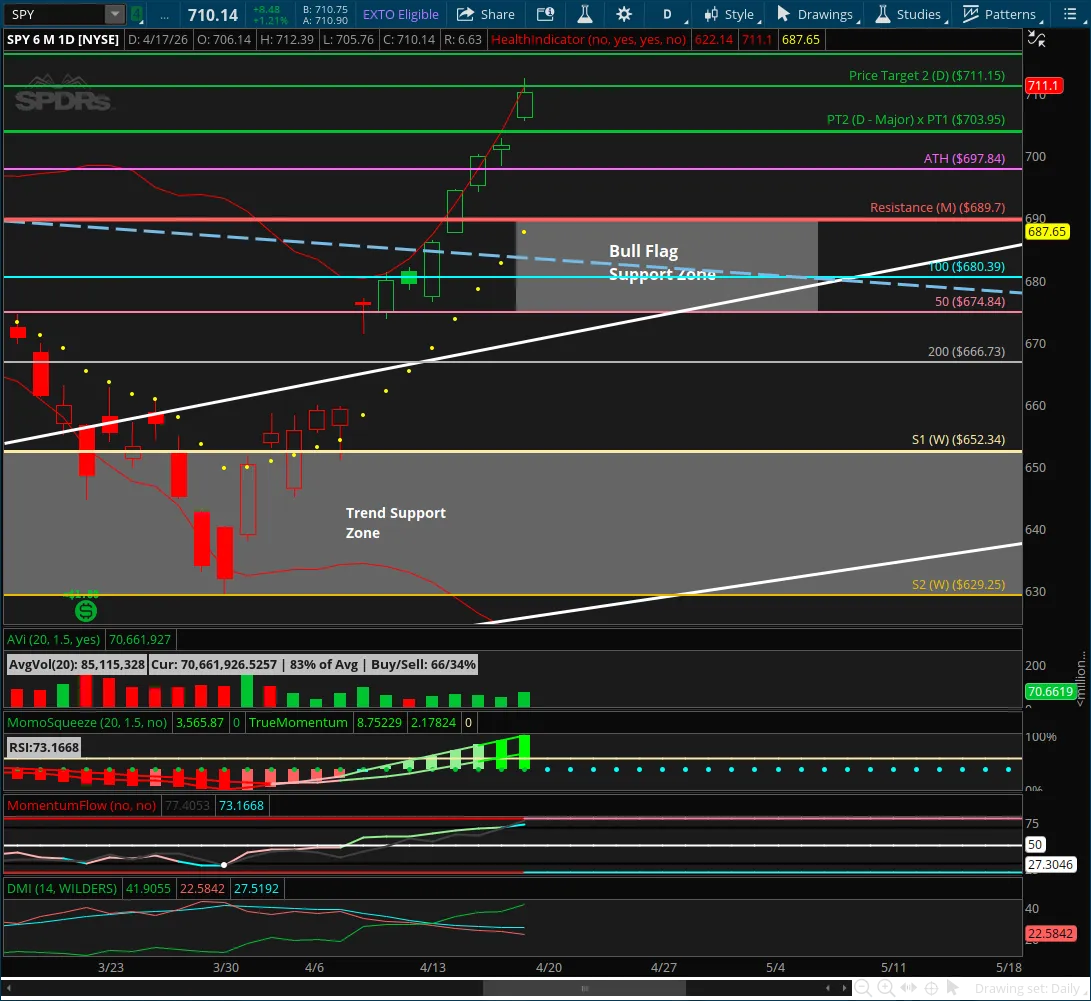
The daily chart has now shifted decisively from recovery attempt into full upside expansion.
Last week we were simply watching to see whether price could break the downtrend, hold the 50SMA, and reclaim the 100SMA.
It did all of that, and more.
Price broke the daily downtrend, reclaimed the 100SMA, pushed through prior resistance, and continued higher all week as momentum fully aligned in favor of the bulls.
That means the prior bearish structure is gone, and the market remains on bull flag watch from the same anchor low as last week.
⸻
📌 Pattern State
Pattern State: Bull Flag Watch
Pattern Start: 651.06 (4/7 low)
Anchor High: Not yet established
Trigger: Bull flag formation requires price to set the first lower high and lower low while holding above its eventual 38.2% retracement and the 100SMA / prior ATH breakout zone
⸻
🔄 Structural Sequence (What Happened)
1️⃣ Monday — Downtrend Break + 100SMA Reclaim
Monday opened weak, but buyers stepped in quickly.
Price rallied hard, broke the daily downtrend, reclaimed the 100SMA, and continued higher into the close.
That confirmed the market was no longer just bouncing, it was actively repairing structure.
It also kept the existing bull flag watch active, with no lower high or lower low forming yet.
⸻
2️⃣ Tuesday — Gap Up, New All-Time High
Tuesday markets gapped higher and pushed through the bands, expanding volatility.
That move also set a new all-time high, confirming that bulls had fully reclaimed control of the daily trend.
⸻
3️⃣ Wednesday — Gap Fill + Continued Push
Wednesday opened with another small gap up, filled the gap intraday, and then pushed strongly higher back into the bands.
That showed buyers were still willing to defend dips aggressively even after the breakout.
⸻
4️⃣ Thursday — Consolidation Begins
Thursday opened higher but spent the day consolidating.
That pause mattered because the average MACD value reclaimed the zero line for the first time since early February, which is an important sign that the daily trend has shifted back toward bullish control.
⸻
5️⃣ Friday — Momentum Fully Aligns, First Rejection Appears
Friday opened with another large gap up.
With DMI and MACD now fully aligned, price was able to push back into the bands again.
That move pushed:
RSI into overbought territory
MFI close to overbought
Price into the next upside extension zone
It also produced the first small but real rejection near highs.
That does not mean a pullback must happen immediately, but it does mean a pullback is now clearly in the cards.
⸻
📐 Immediate Structure Map
The market is now in upside expansion, but the next important event is the formation of the first actual pullback structure.
Key levels now in play:
Support / Structure
Prior ATH breakout zone
100SMA
50SMA
Broken daily downtrend line
Overhead / Extension
703.95
711.15
As long as price holds above the new breakout zone and the 100SMA, the bulls remain in control.
⸻
🔍 Momentum Context
Momentum is now fully aligned with the upside.
• Daily squeeze released upward
• MACD reclaimed the zero line
• DMI crossed bullish
• RSI is now overbought
• MFI is approaching overbought
That is a strong trend configuration.
The only caution here is that price is now becoming short-term stretched, which means the next consolidation or pullback is becoming increasingly likely.
⸻
⚠️ Important Structural Note
We still do not have a completed bull flag.
The same bull flag watch from last week remains active because price never produced the first lower high and lower low needed to establish the pattern.
That means the market is still in the expansion phase, not the pattern phase.
Because the rally was so strong, the eventual pullback will matter a lot.
The most likely retracement zone for that pullback is the area around:
previous ATH resistance
the broken downtrend
the 50SMA / 100SMA zone
That entire region is now the new line in the sand for the market.
If price can hold that area on the next pullback, the odds increase materially that the bulls are truly back in control.
And if the 50SMA crosses back above the 100SMA, that would strengthen the bullish case even further.
⸻
🧭 What Happens Next
Going into this week, the key questions are:
1️⃣ Do We Finally Get the Pullback Needed to Form the Pattern?
We are still waiting for the first lower high and lower low to establish the new bull flag.
That remains the next structural event to watch for.
2️⃣ Where Does the Pullback Find Support?
Because the move higher was so strong, the eventual consolidation is likely to retrace toward:
prior ATH breakout resistance turned support
the broken daily downtrend
the 50SMA / 100SMA area
That is the key support cluster.
3️⃣ Can Bulls Hold the New Line in the Sand?
If price holds that zone on the next pullback, then the breakout likely remains healthy and the market can continue building higher from there.
If it fails, then this upside move risks turning into a blow-off that needs a deeper reset.
⸻
🎯 Bottom Line
Last week answered the main question decisively:
Yes, price broke the downtrend.
Yes, price reclaimed the 100SMA.
Yes, bulls regained momentum control.
The market is now back in upside expansion mode.
But after a move this strong, the next important step is not another breakout. It is the pullback that forms the first real bull flag.
That is what matters this week.
For now:
Bulls are in control
Momentum is strong
Price is stretched
A pullback / consolidation is increasingly likely
If that pullback holds the new support zone, the bullish case strengthens even further.
