SPY Bull Flag Active at 680 as Multi-Timeframe Squeeze Tightens

📆 DAILY CHART OUTLOOK — SPY
Week of March 2, 2026
The daily chart continues to rotate through pattern formation and invalidation inside a larger compression regime.
Last week did not continue the prior bull flag. It reset structure again — and then established a new one.
We are now inside a confirmed daily bull flag.
🔄 Structural Sequence (What Happened)
1️⃣ Early Week: Bull Flag Failure
Instead of continuing the prior bull structure:
Monday: Lower high + lower low
Closed below 38.2% retracement
Pattern invalidated
That immediately opened the door to a new bear flag attempt.
2️⃣ Tuesday → Wednesday: Bear Flag Attempt Fails
Tuesday printed another lower high and lower low intraday
Wednesday gapped higher
Closed above that pattern’s 38.2%
Bear flag invalidated
Another structure erased.
Chop behavior continues.
3️⃣ Thursday: New Bull Flag Established
The current active structure formed as follows:
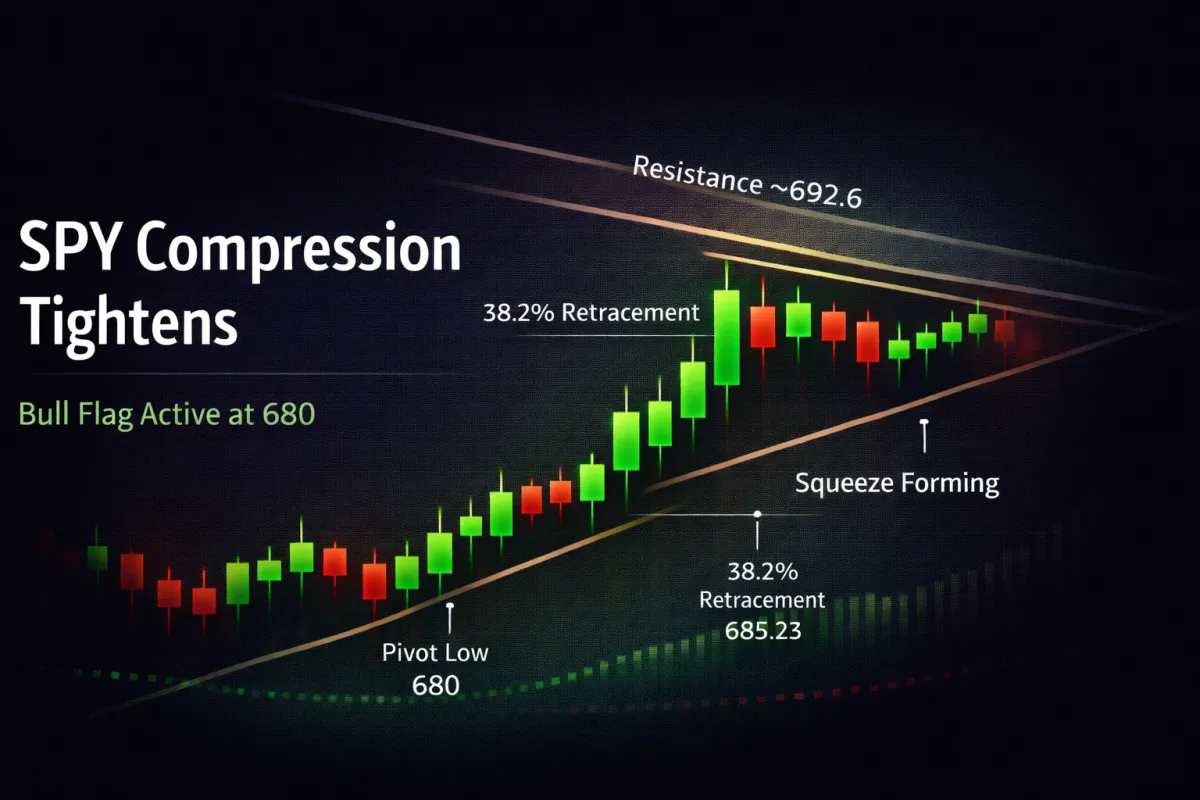
Pattern Low: 680 (Tuesday 2/24)
Pattern High Anchor: 693.68 (Wednesday 2/25)
38.2% Retracement Level: 685.23
On Thursday (2/26):
Price printed a lower high and lower low
Closed above 685.23 (38.2%)
Validated the bull flag
That officially established the pattern.
4️⃣ Friday: Pattern Holds
Friday:
Gapped lower
Held above 100SMA
Reclaimed bull flag support into the close
Pattern remains valid
📌 Active Pattern State
Active Pattern: Daily Bull Flag
Low Anchor: 680 (2/24)
High Anchor: 693.68 (2/25)
38.2% Level: 685.23
Support Floor: 680
Structural Invalidation: Close below 680
The pattern remains active as long as price holds above 680 on a closing basis.
📐 Immediate Structure Map
We are still inside the larger chop zone between:
675.78 (prior bear support / 100SMA zone)
692.6 (major resistance + trendline overhead)
For this bull flag to mature, price must:
Push through 692.6 + downtrend line
Clear ATH resistance 697.14–697.84
Build structure above that zone
Without that, this remains another compression attempt.
🔍 Momentum Context
Daily squeeze has now been active for the entire month of February
MACD remains below zero
DI- > DI+
ADX beginning to rise
This is critical:
Momentum is not yet aligned with the bull flag.
If bulls do not reclaim control quickly, the rising ADX with DI- leading could flip this back into bearish pressure.
🧭 What Matters This Week
🟢 Bullish Continuation
If price:
Holds above 685.23
Continues making higher highs and higher lows
Breaks 692.6 + trendline
And momentum confirms (squeeze release, MACD turning up, DI+ overtaking DI- with rising ADX)
Then this structure could finally break the multi-month chop.
🔴 Bearish Reversal Trigger
If price:
Closes below 680
And especially loses 100SMA again
Then breaks 675.78
A new daily bear flag will form from below.
That would likely point price back toward the weekly support zone outlined in higher timeframe analysis.
Given:
MACD below 0
DI- currently leading
ADX rising
If this flips, it could accelerate quickly.
🎯 Bottom Line
We are inside:
A confirmed daily bull flag
Anchored at 680 (2/24)
With 685.23 as the key retracement pivot
Inside a one-month daily squeeze
Inside a weekly squeeze
Inside a three-month chop range
This week is critical.
If bulls cannot expand soon, the rising ADX favors downside pressure.
If they can, the compression across timeframes could release explosively.
The structure is clear.
Now we watch how it behaves.
