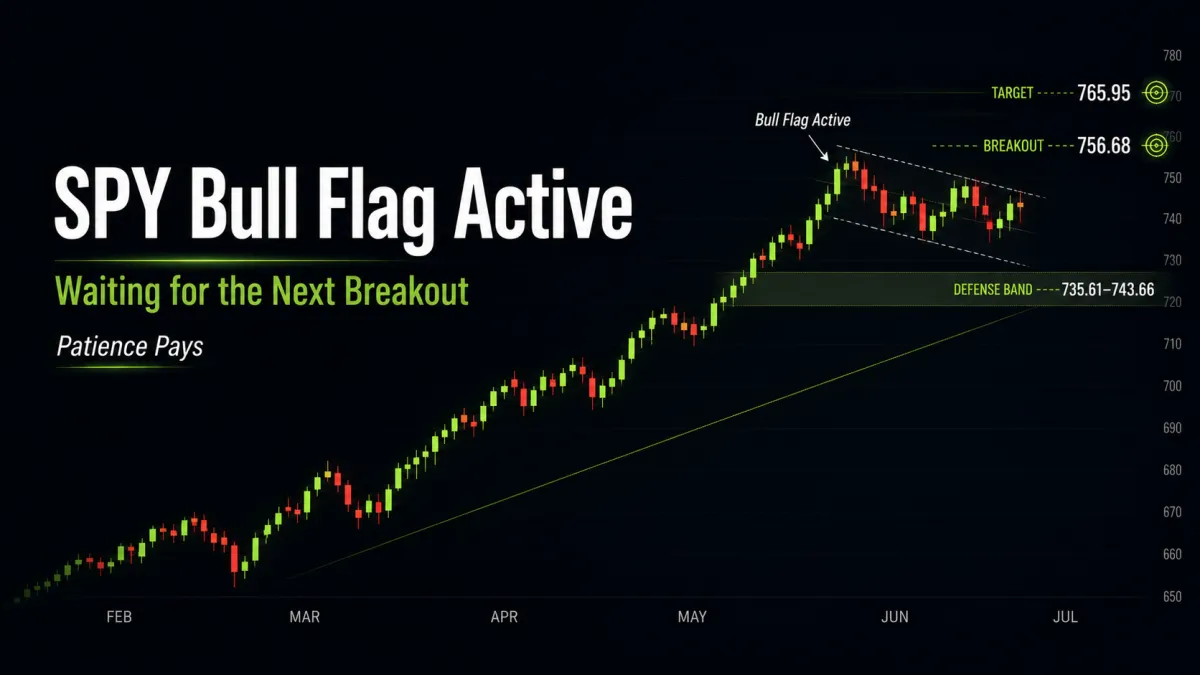
SPY Consolidates Beneath Highs, Bull Flag Still in Play
📆 DAILY CHART OUTLOOK — SPY
Week of June 22, 2026
The daily chart is no longer on bear-flag watch.
That bearish structure broke early in the week, and price immediately shifted into a new bull flag watch instead. The market has not broken out yet, but it has now built a defined bullish structure with clear support, clear resistance, and a very obvious decision zone.
That is the key point.
We are now in a patience pays phase on the daily. Bulls have a valid setup, bears still have mixed momentum readings on their side, and price has not yet resolved the consolidation.
⸻
📌 Pattern State
Pattern State: Bull Flag Active
Pattern Start: 722.59 (6/9 low)
Anchor High: 756.68 (6/15 high)
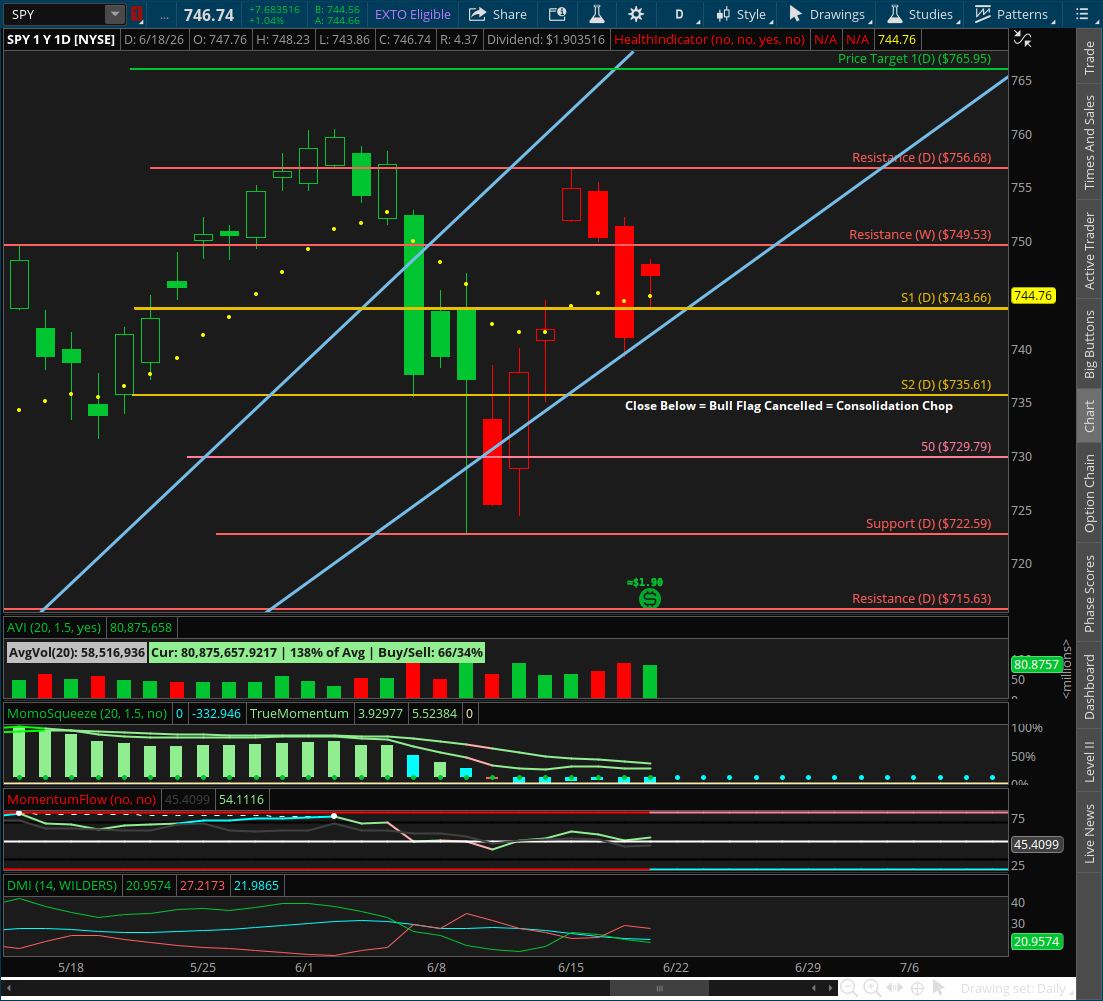
Trigger: Bull flag remains active as long as price holds above 735.61, and continuation is confirmed on a close above 756.68
⸻
🔄 Structural Sequence (What Happened)
1️⃣ Monday — Bear Flag Breaks, New Bull Flag Watch Begins
Monday’s strong gap higher broke the prior bear flag resistance band.
That immediately canceled the bearish setup and put a new bull flag on watch.
It was the first sign that the pullback phase might be transitioning into bullish consolidation instead of deeper correction.
⸻
2️⃣ Tuesday — New Bull Flag Established
Tuesday printed a lower high and lower low, which established the new bull flag structure.
That gave us the new defense band between:
735.61
743.66
And defined the pattern clearly:
Anchor Low: 722.59 (6/9)
Anchor High: 756.68 (6/15)
⸻
3️⃣ Wednesday — Selloff into the Defense Band
Wednesday sold off, lost the 10EMA (D), and pushed down into the support / defense band.
That was the first real test of the newly formed bull flag.
Price did not break the structure, but it did show that bulls were not fully in control yet.
⸻
4️⃣ Thursday — Gap Up, Selloff, Support Reclaimed
Thursday gapped higher, sold off intraday, but still managed to reclaim and close back above 743.66.
That mattered.
It showed the new defense band was still being respected and kept the bull flag active going into the long weekend.
⸻
5️⃣ Friday — No Market Session (Juneteenth)
Markets were closed Friday for Juneteenth, so there was no regular-session follow-through.
That leaves the daily chart sitting right in the middle of a defined consolidation structure going into this week.
⸻
📐 Immediate Structure Map
The new bull flag is now active.
Key levels now in play:
Bull Flag Resistance / Breakout
756.68 (bull flag resistance / breakout trigger)
Defense Band
743.66
735.61
Structural Support
50SMA
722.59 (bull flag low)
below that: 715.63
As long as price holds above 735.61, the bull flag remains active.
A close above 756.68 confirms continuation and opens the way toward the next upside target at 765.95.
⸻
🔍 Momentum Context
The daily is mixed right now.
• MACD is above the zero line, but not crossed bullish
• DMI is still bearish
• RSI is above 50
• TTM Squeeze is still negative
That last point matters most.
The chart is telling us that bulls have structure, but not yet fully aligned momentum.
If the squeeze histogram flips back positive, that would add the missing confirmation bulls need for a cleaner breakout shot above 756.68.
Until then, this remains consolidation, not resolution.
⸻
⚠️ Important Structural Note
There are really two clean paths from here.
1️⃣ Bullish Resolution
If price continues holding above the defense band and the 50SMA, then dips are likely still being bought.
If the squeeze flips positive and price closes above 756.68, the bull flag confirms continuation and the next upside objective becomes:
765.95
That would likely create strong upside opportunity across the board, especially in leaders.
2️⃣ Bearish Resolution
If price loses the 50SMA and breaks below 735.61, the bull flag weakens materially.
At that point, the next likely move is a choppy rotation back toward prior support / resistance.
If that deepens enough to break 722.59, then the market is likely heading back toward the major breakout retest zone at:
715.63
That would be the next major bull-defense test.
⸻
🧭 What Happens Next
Going into this week, the key questions are:
1️⃣ Does Price Hold Above 735.61?
If yes, the bull flag remains active and consolidation continues.
2️⃣ Does the Squeeze Flip Positive?
That is the cleanest momentum tell for whether bulls are about to take control again.
If it does, the odds improve materially that price breaks above 756.68 and continues higher.
3️⃣ Does Price Lose the 50SMA and Defense Band?
If that happens, then the market likely rotates lower first and puts 722.59 and then 715.63 back in play.
⸻
🎯 Bottom Line
The daily has shifted again.
The prior bear flag failed, a new bull flag is now active, and price is sitting in the middle of a defined consolidation range.
722.59 = anchor low
756.68 = anchor high
735.61–743.66 = defense band
As long as price stays above 735.61, the bull flag remains valid.
If price breaks above 756.68 with improving momentum, bulls likely get continuation toward 765.95.
If price loses the defense band and the 50SMA, then the market likely rotates lower first.
Until one of those happens, this is a patience pays phase.
That means:
don’t force bigger swing expectations
stay focused on intraday price action
and let the market tell you whether bulls or bears are actually taking control before committing harder in either direction.
