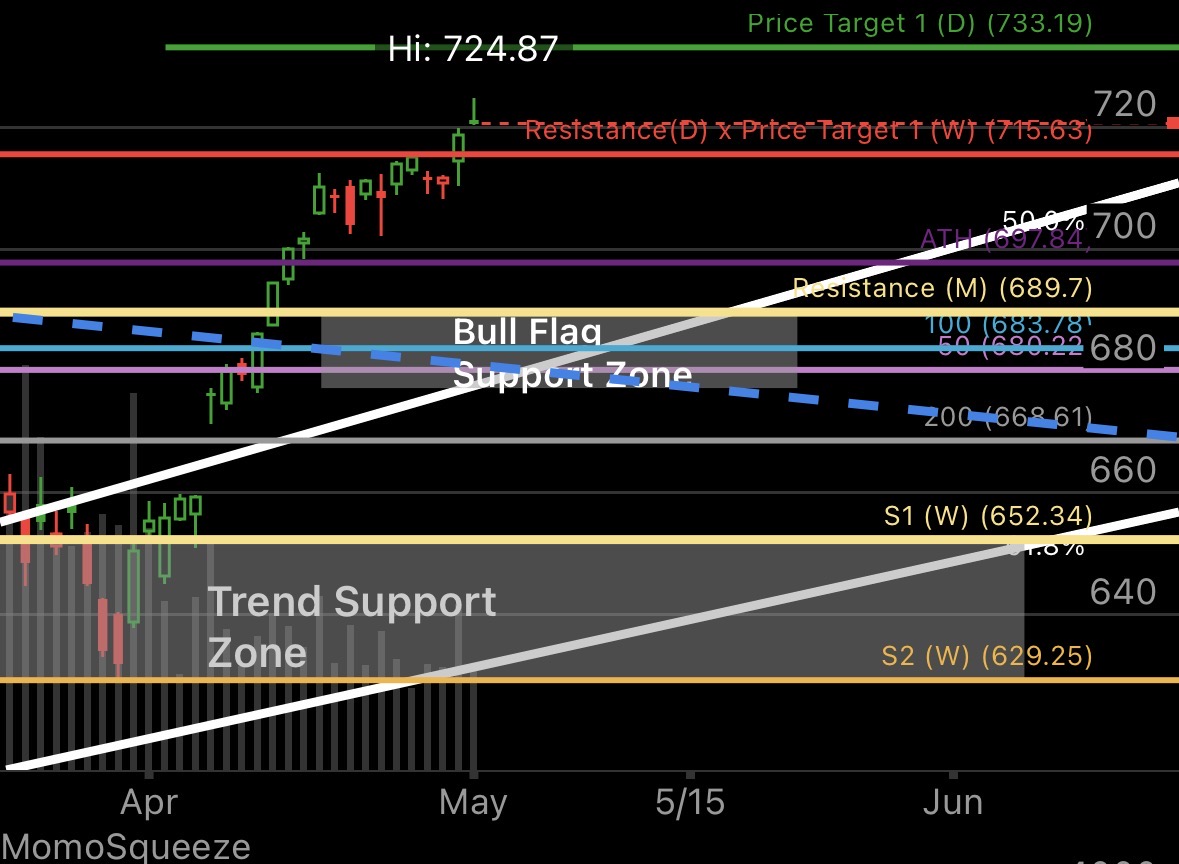
SPY Bull Flag Breakout Active as Bulls Eye 733.19

📆 DAILY CHART OUTLOOK — SPY
Week ofMay 4, 2026
The daily chart is now giving us the clearest view of the trend.
Last week, the market finally did what we had been waiting for, itcompleted the first real bull flag setupafter weeks of straight upside expansion from the4/7/26 low at 651.06.
That pattern did not sit around long.
It formed, held, and thencontinued higher almost immediately, which tells us bulls remain firmly in control for now.
What matters most now is whether this breakout keeps extending right away, or whether the market needs to retest it first before pushing to the next major targets.
⸻
📌 Pattern State
Pattern State:Bull Flag Active
Pattern Start:651.06 (4/7 low)
High Anchor:715.63 (4/27 high)
Trigger:Thursday’s close above 715.63 confirmed continuation from the newly formed bull flag
⸻
🔄 Structural Sequence (What Happened)
1️⃣ Monday — High Anchor Set
Monday price continued pressing higher and came just shy of the first major weekly target at716.3.
That session established thehigh anchorfor the newly forming bull flag at:
715.63
At that point, the market had still not produced the first lower high and lower low needed to complete the pattern, but Monday marked the high that the next pullback would be measured against.
⸻
2️⃣ Tuesday — First Pullback Arrives
Tuesday produced the first modest pullback after so many sessions of straight upside expansion.
Price found support at the lows and closed as adoji, signaling indecision rather than outright weakness.
That candle was the first real pause in the move and began the process of forming the bull flag.
⸻
3️⃣ Wednesday — Support Holds
Wednesday tested the lows again, but buyers continued defending support.
Price closed near the highs of the day, keeping the developing bull flag intact and leaving the market in position to push higher into the end of the week.
⸻
4️⃣ Thursday — Breakout Confirmed
Thursday markets exploded higher and closedabove Monday’s high anchor at 715.63.
That move confirmed the bull flag continuation and put the pattern into active breakout mode.
The consolidation had done its job, and price resumed the larger upside trend.
⸻
5️⃣ Friday — Gap Up, Rally, Rejection
Friday opened with another gap higher, rallied, and then sold off into the close.
That was the first clear sign of rejection since this rally phase began.
It doesnotmean the breakout has failed, but it does put a near-term retest squarely on the table, especially with RSI still pushing off the overbought zone after such a strong move.
⸻
📐 Immediate Structure Map
The bull flag is now active and in continuation mode, but Friday’s candle opens the door to a retest.
Key levels now in play:
Continuation / Resistance
Friday’s high
733.19(first daily target)
746.25(second weekly target / first major monthly target)
Support / Retest Levels
Friday’s low
10EMA
715.63(breakout level)
697.84(former ATH)
689.7(monthly resistance)
As long as price remains above the key support stack, the active structure remains bullish.
⸻
🔍 Momentum Context
Momentum remains firmly aligned with the bulls.
•DMI remains bullish
•MACD remains bullish
•RSI continues bouncing off the overbought zone
• Lower timeframes, especially the4-hour, still show room for expansion
That means the broader trend still favors upside continuation.
The only question is whether the market extends immediately, or needs to cool off first.
⸻
⚠️ Important Structural Note
Because the pattern formed and broke out so quickly, aretest of the breakout is not unlikely at allfrom here.
That makesMonday’s open and close especially important.
The main short-term line in the sand is now:
The 10EMA
If price breaks, and especiallycloses below Friday’s low, that would likely take the bull flagout of continuation modeand send price into a retest / consolidation phase while RSI cools.
That would not automatically be bearish.
It would simply mean the market needs to reset before the next push.
If that retest fails to hold, then the next levels below become:
697.84
689.7
Those are the most likely areas where buyers would step in again if the pullback deepens.
⸻
🧭 What Happens Next
Going into this week, the key questions are:
1️⃣ Does Price Break Friday’s High?
If yes, then the breakout likely continues and price can push toward:
733.19
then potentially746.25
That would keep the move in clean upside expansion mode.
2️⃣ Does Price Break and Close Below Friday’s Low?
If yes, then the bull flag likely exits continuation mode and begins a retest / consolidation phase.
That would most likely send price back toward the10EMAand the breakout zone.
3️⃣ If a Retest Comes, Does It Hold?
If the retest holds above the key support stack, then the larger bullish structure remains healthy and the trend likely resumes after RSI cools.
If it fails, then the market likely retraces deeper toward:
697.84
689.7
before trying to rebuild.
⸻
🎯 Bottom Line
The daily trend remains bullish.
Last week finally gave us the first completed bull flag after weeks of straight upside expansion, and that pattern already broke out.
That keeps the market in bullish continuation mode for now.
But Friday’s rejection means the next move matters.
So this week the key battleground is simple:
Break Friday’s highand the move likely continues toward733.19and746.25
Break and close below Friday’s lowand the market likely enters a needed retest / consolidation phase
For now:
Bulls are still in control
Momentum remains strong
The 10EMA is the line in the sand
Monday’s reaction will matter more than usual
