
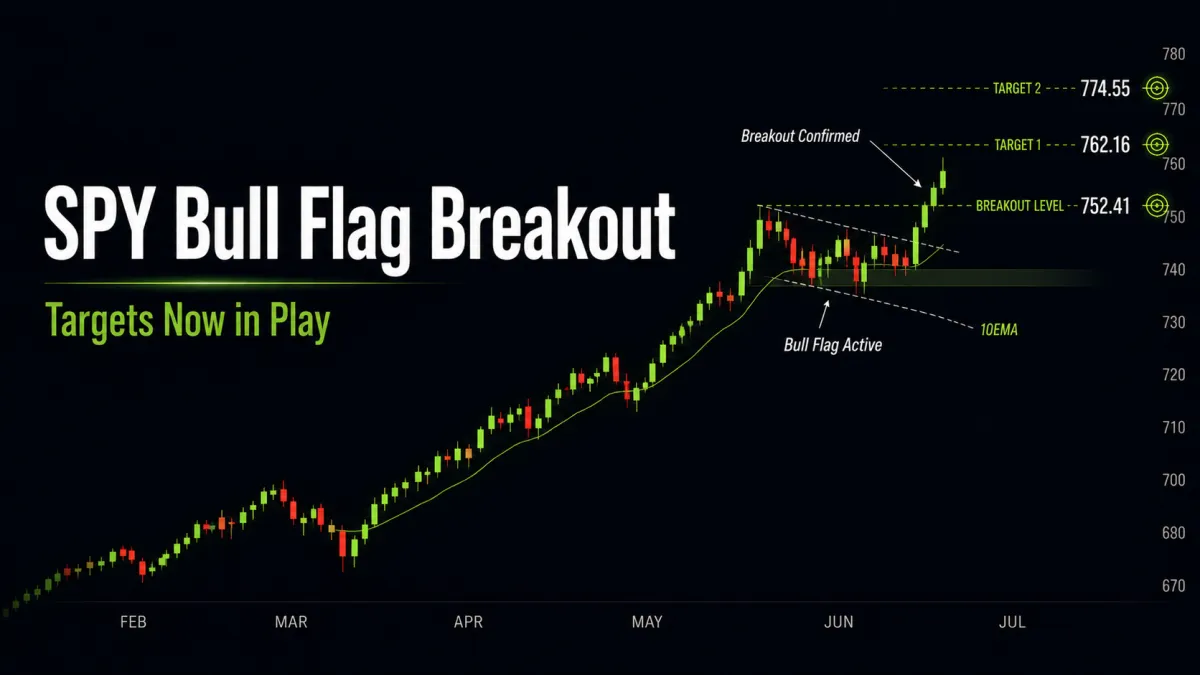
SPY Bull Flag Breakout Confirmed as Upside Targets Come Into View
📆 DAILY CHART OUTLOOK — SPY
Week of July 13, 2026
The daily chart finally completed the bull flag structure we had been waiting for.
After several weeks of patterns forming and invalidating inside consolidation, last week produced a clean bullish setup with defined anchors, a successful support test, and a confirmed breakout above resistance.
The bull flag is now active and in continuation mode.
⸻
📌 Pattern State
Pattern State: Bull Flag Active
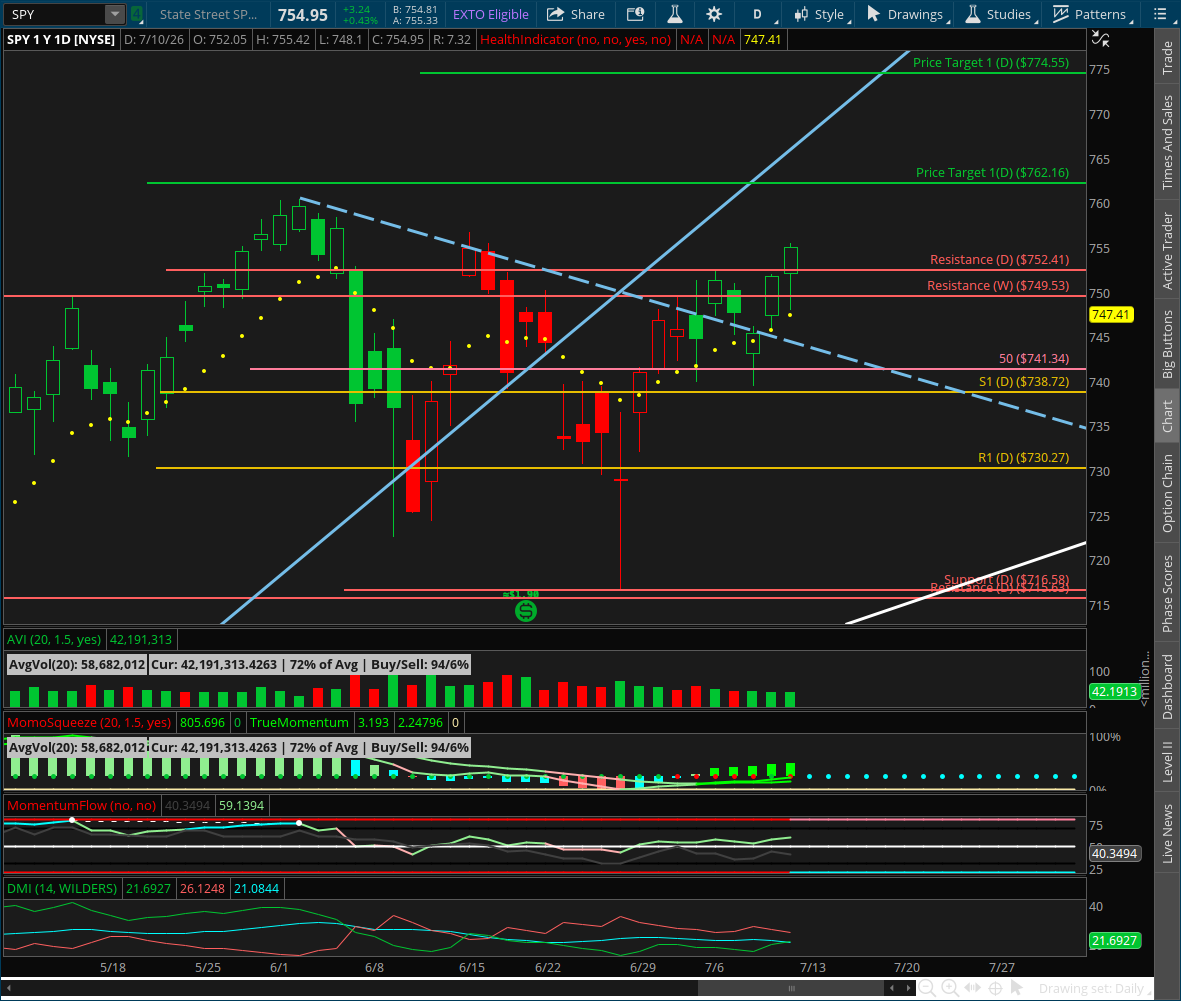
Low Anchor: 716.58 (6/26 low)
High Anchor: 752.41 (7/6 high)
Continuation Trigger: Friday’s close above 752.41 confirmed bull flag continuation
Continuation Condition: Price holds above the daily 10EMA
Structural Invalidation: Loss of the bull flag support structure, with deeper risk increasing below the 6/26 low at 716.58
⸻
🔄 Structural Sequence (What Happened)
1️⃣ Monday — Upside Expansion Continues
Monday printed a higher high and higher low.
That continued the bullish sequence from the 6/26 anchor low and established the eventual bull flag high at:
752.41
At that point, the pattern was still expanding and had not yet formed.
⸻
2️⃣ Tuesday — Bull Flag Established
Tuesday pulled back and printed the first lower high and lower low following the expansion from the anchor low.
That completed the new bull flag structure.
The pattern was now established with:
Low Anchor: 716.58
High Anchor: 752.41
⸻
3️⃣ Wednesday — Support Holds
Wednesday pulled back further and tested the developing bull flag support structure.
Buyers stepped in just above the defense area, and price held above both:
the 50SMA
the 10EMA
That kept the newly established bull flag valid.
⸻
4️⃣ Thursday — Resistance Test
Thursday pushed higher and came just shy of breaking above the bull flag resistance level at:
752.41
The pattern remained active, but continuation had not yet been confirmed.
⸻
5️⃣ Friday — Bull Flag Breakout Confirmed
Friday opened above 752.41, pulled back during the morning, and retested the weekly breakout level.
Buyers defended that retest, and price rallied through the remainder of the session before closing above bull flag resistance.
That close confirmed continuation from the active bull flag and brought the upside targets into play.
⸻
📐 Immediate Structure Map
The bull flag is active and continuation is underway.
Upside Targets
Target 1: 762.16
Target 2: 774.55
Key Support
10EMA (D) — immediate continuation line
749.53 — weekly breakout level
bull flag defense structure below
716.58 — pattern low and major structural invalidation level
As long as price holds above the 10EMA, the active flag remains in continuation mode and price is looking to rally toward its targets.
⸻
🔍 Momentum Context
Momentum is improving alongside the breakout.
TTM Squeeze has turned positive
price closed above daily bull flag resistance
weekly resistance was reclaimed and successfully retested
price remains above the 10EMA and 50SMA
the larger weekly trend remains bullish
The remaining momentum studies are not all perfectly aligned yet, but price structure has now provided the most important confirmation:
the pattern formed, support held, and resistance broke.
⸻
⚠️ Important Structural Note
Friday’s breakout is meaningful because it came after a successful retest of the weekly breakout level.
That gives the move better structure than a simple gap-and-run breakout with no support test beneath it.
The next key question is whether price can preserve that structure by continuing to hold above the 10EMA.
If it does, then:
762.16 is the first objective
774.55 becomes the second objective
If price loses the 10EMA, continuation pauses and the market may return to consolidation before trying again.
That would not automatically invalidate the entire bull flag, but it would remove the clean continuation condition and shift attention back toward support.
⸻
🧭 What Happens Next
1️⃣ Does Price Hold Above the 10EMA?
If yes, the bull flag remains in continuation mode and the next likely destination is 762.16.
2️⃣ Does Price Reach and Hold Above Target 1?
A clean move through 762.16 would keep momentum expanding and put 774.55 firmly in play.
3️⃣ Does the Breakout Lose Momentum?
If price falls below the 10EMA, the immediate continuation phase pauses and another period of consolidation becomes more likely.
The reaction around 749.53 and the underlying bull flag defense structure would then determine whether the breakout remains healthy or begins to fail.
⸻
🎯 Bottom Line
The bull flag we had been waiting for is now fully formed and active.
Low Anchor: 716.58 (6/26)
High Anchor: 752.41 (7/6)
Breakout confirmed: Friday close above 752.41
Target 1: 762.16
Target 2: 774.55
As long as price holds above the daily 10EMA, continuation remains in play.
After weeks of pattern formation, invalidation, and consolidation, the market finally has a clean bullish structure again.
Now the focus shifts from waiting for the pattern to form to watching whether price can follow through toward its targets.
