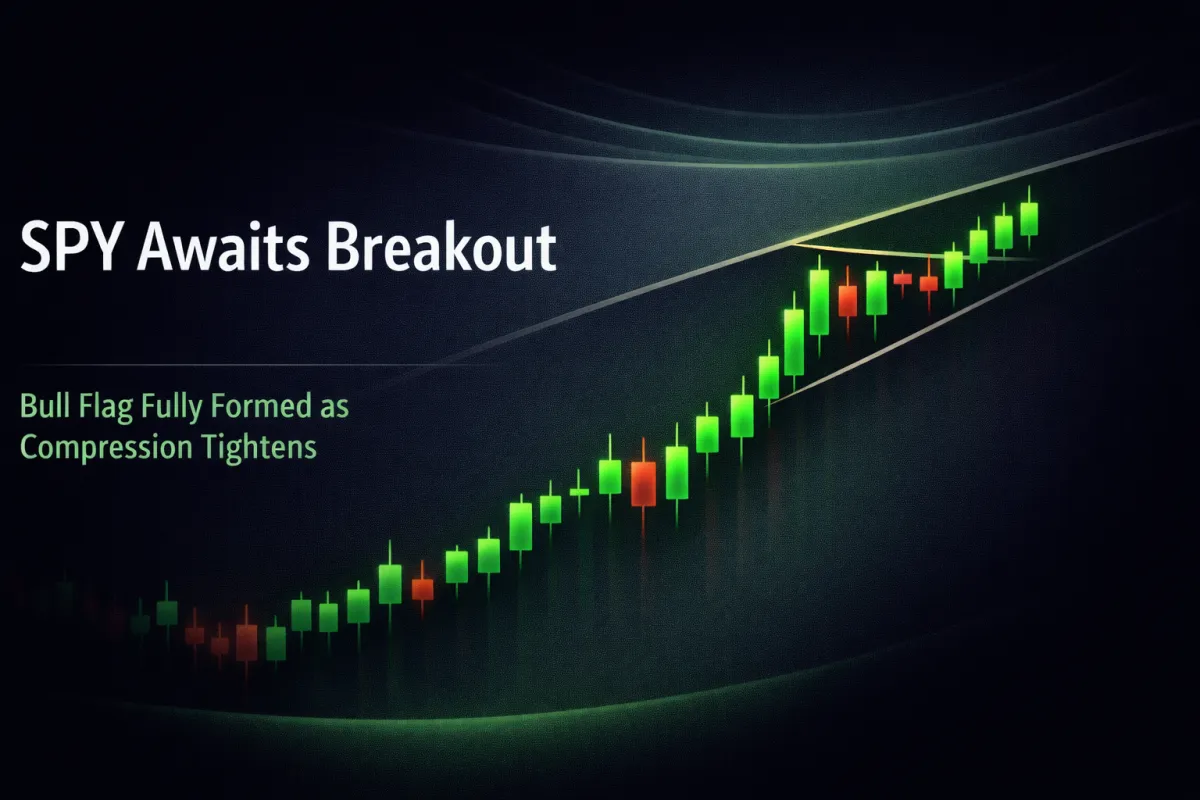
SPY Bull Flag Built — Market Awaits Breakout or Breakdown

📆 DAILY CHART OUTLOOK — SPY
Week of February 2, 2026
Last week extended the bull flag structure — but Thursday’s sharp selloff reminded everyone that momentum is still fragile in this environment.
🔁 Monday → Wednesday: Bull Flag Builds
Price opened the week strong:
✅ Monday and Tuesday printed higher highs and higher lows, continuing the active bull flag build
🛑 Wednesday opened strong but stalled, fading into the close — a warning that follow-through was slowing
🚨 Thursday: Pattern Defined
Price opened lower and dropped sharply, falling from 697 to below 685 in just two hours
Buyers stepped in intraday, recovering much of the loss
But this established the first lower high and lower low of the entire flag pattern, formally marking the end of the build phase
The drop retraced into the bull flag’s expected support zone (between the 61.8% and 38.2% retracement levels), and buyers defended
🧲 Friday: Inside Bar at Support
Price opened lower again but held above 689.7, printing an inside day
This confirms we’re now coiled inside a tight range between flag support and resistance
Compression is tightening — and a breakout or breakdown from this pattern is likely imminent
⏳ Current Structure = Compression Between Key Levels
With Friday’s close at 691.97, SPY is coiled between:
683.67 – Bull flag support / prior resistance
697.84 – Local high / bear flag resistance
A breakout or breakdown from this range will likely dictate the next directional move.
🧭 What to Watch This Week
🟢 Bullish Flag Continuation
If price breaks above 697.84, the active bull flag confirms and continuation begins
Target = 703.95, aligning with the Major Flag PT2
Momentum would shift back toward bulls, especially if MACD and DMI strengthen in sync
⚖️ Neutral / Continued Chop
If price remains between 683.67 and 697.84, expect more compression
Bollinger Bands will tighten
Squeeze conditions are likely
Any breakout attempt that stalls will simply extend the range — keep expectations disciplined
🔻 Bearish Breakdown
If price closes below 683.67, the bull flag breaks
A move below the 50SMA would target the 100SMA and trend support
Watch MACD for a potential bearish crossover — and DMI to flip in favor of sellers
That kind of structure shift would increase risk of a deeper pullback and could begin cooling off the overheated monthly RSI
🎯 Bottom Line
The bull flag is no longer “forming” — it’s fully built, and Thursday’s price action completed the pattern structure.
Now we’re watching for confirmation.
This is:
A valid setup with clearly defined structure
A tape that punishes premature swings and rewards precision
An environment that demands clean breakouts and fast execution
If price confirms with strength above 697.84, that opens the door for a high-probability continuation toward 703.95 and beyond.
→ Let structure guide.
→ Let price confirm.
→ And above all, let theta bleed someone else — not you.
