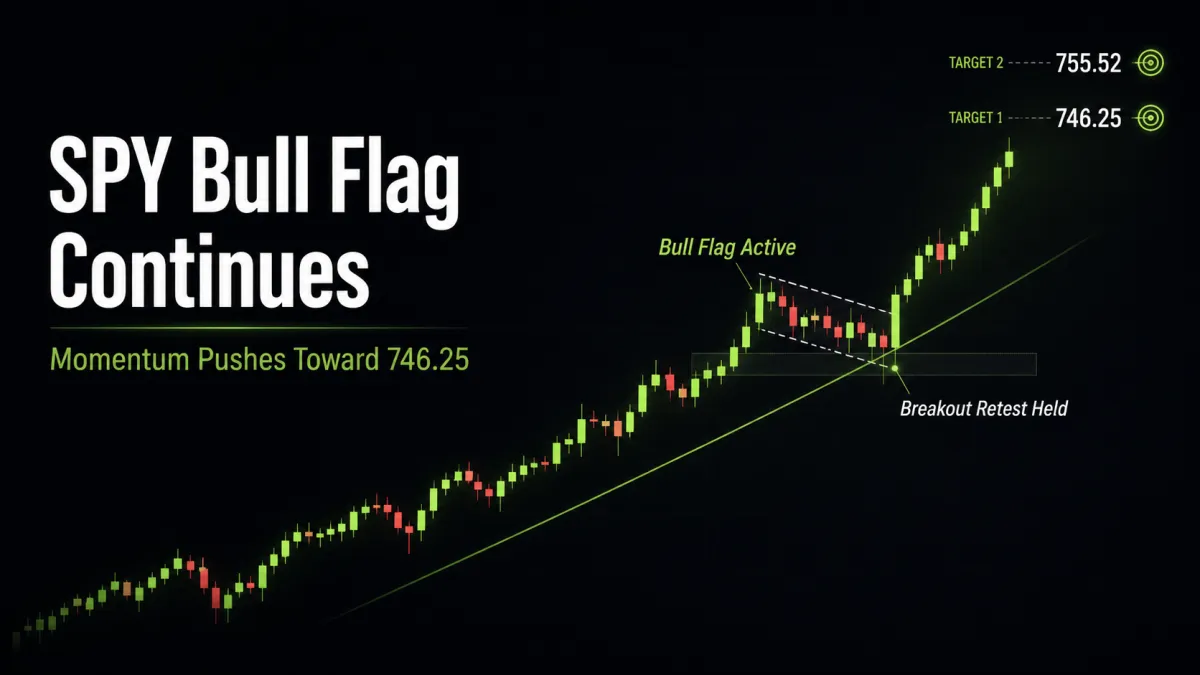
SPY Bull Flag Continues as Momentum Pushes Toward 746.25

📆 DAILY CHART OUTLOOK — SPY
Week of May 11, 2026
The daily chart remains strongly bullish, and last week’s price action confirmed that the breakout is real.
Coming into the week, we noted that after such a large breakout candle and topping tail, the market would likely retest the breakout level if price broke below Friday’s low.
That is exactly what happened.
Price opened lower Monday, retested the breakout area, found support, and then continued higher through the rest of the week, ultimately reaching the first daily target at 733.19.
At this point, bulls remain firmly in control, but price is becoming increasingly overbought and a short-term cooling phase is likely getting closer.
⸻
📌 Pattern State
Pattern State: Bull Flag Active
Pattern Start: 651.06 (4/7 low)
High Anchor: 715.63 (4/27 high)
Trigger: Thursday, 5/1 breakout above 715.63 confirmed continuation from the active bull flag
⸻
🔄 Structural Sequence (What Happened)
1️⃣ Monday — Breakout Retest Holds
After opening below Friday’s low, price rallied in the morning to fill the imbalance, then sold off into a retest of the breakout above 715.63 before finding support.
That was the retest we had been watching for.
Importantly, support held, which kept the breakout valid and left the bull flag in continuation mode.
⸻
2️⃣ Tuesday — Gap Up, Tight Range
Tuesday markets gapped higher but stayed in a relatively tight range.
That was a constructive pause, not weakness.
The market held its gains and remained in clean bullish continuation.
⸻
3️⃣ Wednesday — First Target Reached
Wednesday brought a large gap up and strong rally into the first target that had been on watch:
733.19
That was a major confirmation that the breakout leg had real strength behind it.
⸻
4️⃣ Thursday — High Holds, Trend Continues
Thursday sold off from that area but found support near the lows while still printing a higher high and higher low.
That mattered.
Even with intraday selling, price action continued to respect the bullish structure.
⸻
5️⃣ Friday — Smaller Candle, Higher High and Low Again
Friday printed another higher high and higher low, but with a smaller candle.
That does not mean the move is broken.
It does, however, reinforce the idea that price is becoming stretched and likely approaching a point where momentum will need to cool before the next sustained leg higher.
⸻
📐 Immediate Structure Map
The bull flag remains active and in continuation mode.
Key levels now in play:
Continuation / Resistance
733.19 (first daily target, now reached)
746.25 (second weekly target / first monthly target confluence)
755.52 (second daily target)
Support / Retest Levels
715.63 (breakout resistance / first weekly target zone)
10EMA
697.84 (former ATH)
689.7 (monthly resistance)
As long as price remains above the breakout stack and especially above the 10EMA, the active structure remains bullish.
⸻
🔍 Momentum Context
Momentum is very strong right now.
• Price has reached escape velocity after the breakout
• RSI is now very overbought
• MFI has been tapping overbought as well
• DMI remains bullish
• MACD remains bullish
• Price continues making higher highs and higher lows
This is the kind of momentum that can stay overbought longer than most expect.
So overbought does not mean bearish.
It means the move is strong, but getting increasingly vulnerable to a short-term cooling phase after this leg completes.
⸻
⚠️ Important Structural Note
A few things matter most from here.
1️⃣ We’ve Reached Escape Velocity
Momentum is no longer tentative. This breakout is real and strong.
2️⃣ Daily Moving Averages Are About to Improve Further
The 50SMA is very close to crossing back above the 100SMA.
If that happens this week, the daily SMA stack would move back toward the more optimal bullish alignment:
50 > 100 > 200
That would be a strong sign that additional 52-week highs are likely still ahead.
3️⃣ A Pullback Is Still Likely After This Leg Completes
Because the move has been so strong, a pullback after the near-term top is still likely.
The most probable place for that top to form is somewhere between:
746.25
755.52
After that, a retest of the breakout / first weekly target zone is likely where support would show up again.
⸻
🧭 What Happens Next
Going into this week, the key questions are:
1️⃣ Does Price Continue to the Next Target Zone?
With momentum this strong, price still looks capable of pushing toward:
746.25
and possibly 755.52
before a more meaningful pullback arrives.
2️⃣ When Does the First Cooling Phase Begin?
RSI is now clearly overbought, and while that has been fueling the move, it also tells us a short-term cooling phase is getting closer.
3️⃣ Where Does the Pullback Find Support?
Once the near-term top is found, the most likely retest zone is:
715.63
10EMA
the first weekly target / breakout area
That is the area where bulls will most likely need to defend the trend again.
⸻
🎯 Bottom Line
Bulls are back with a vengeance.
The breakout held, the retest worked, and price pushed to the first daily target at 733.19 exactly as the structure suggested it could.
Momentum is now very strong, and the next likely path remains higher.
But with RSI very extended, the market is also getting closer to the kind of short-term top that leads to a needed pullback and reset before continuing higher again.
So for now:
Bulls remain firmly in control
The breakout is real
The trend is strong
A near-term top is likely approaching somewhere between 746.25 and 755.52
After that, the breakout zone is where support will likely matter most again
