SPY Coiling Again: Bull Flag Rebuild Begins at 681.55

📆 DAILY CHART OUTLOOK — SPY
Week of February 23, 2026
The daily chart remains volatile and pattern-sensitive, but we are no longer outside structure.
We are now inside a newly forming daily bull flag.
🔄 Structural Context
Last week began with a developing bear flag. That bear flag was invalidated on Friday when price closed above its 38.2% retracement (688.98).
That invalidation created the conditions for a new bullish structure.
📌 Newly Forming Pattern
Pattern Type: Bull Flag (early stage)
Pattern Low: 681.55 (set Thursday 2/19)
This low followed the bear flag invalidation sequence
Friday confirmed a higher low relative to that 2/19 pivot
This means:
We are now actively monitoring whether price can continue forming higher highs and higher lows from 681.55.
That 2/19 low is now the structural anchor.
If price loses 681.55 on a closing basis, this newly forming bull flag is invalidated.
That level matters.
📐 Immediate Structure Map
Key zones:
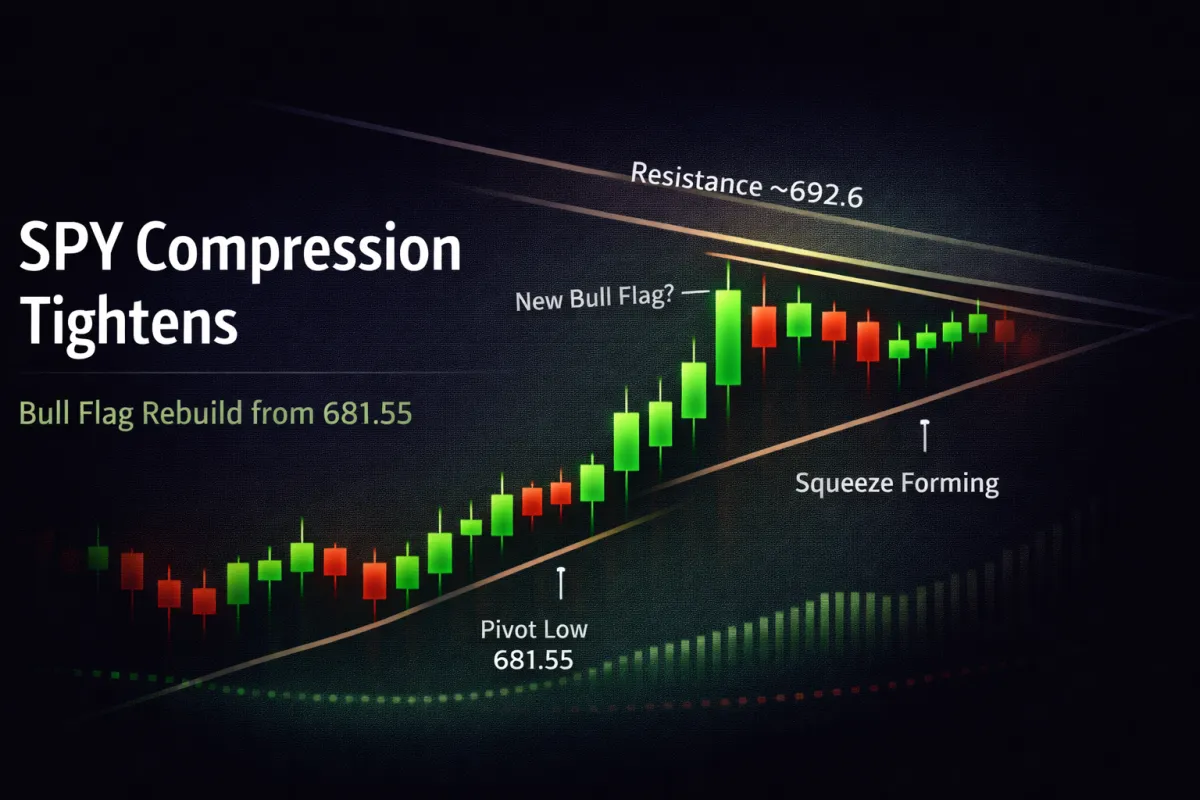
681.55 → Newly forming bull flag low
675.78 → Prior bear support / 100SMA region
692.6 → Major resistance (October bull flag target)
Downtrend line overhead
ATH zone 697.14–697.84
This entire region has been a multi-month compression zone.
The difference now is we have a fresh structural low.
🔍 Momentum State
Current daily study positioning:
Daily squeeze active
Histogram recently negative, now at risk of flipping
MACD attempting to stabilize
ADX still low
DMI in transition
This is still compression behavior — not confirmed trend behavior.
🟢 Bullish Development Path (Active Structure)
For this new bull flag to mature:
Price must continue printing higher highs and higher lows above 681.55.
First objective: 692.6 + downtrend resistance.
If cleared, next test: ATH resistance 697.14–697.84.
The most bullish outcome would be forming a new bull flag above ATH resistance.
Additionally, the stacked confirmation we are watching for:
Squeeze releases upward
Histogram flips positive
MACD crosses bullish with follow-through
DI+ crosses above DI- while ADX rises
That combination would mark the first legitimate trend expansion attempt in weeks.
🟡 Most Likely Near-Term
Given the past three months:
Rally into resistance
Stall
Whipsaw or sharp fade
Unless momentum confirms, chop remains the default state.
🔴 Bearish Reversal Trigger
If price:
Closes below 681.55 → new bull flag invalidated
Then breaks 675.78 / 100SMA → opens path to prior bear targets
That would likely align with:
Histogram staying negative
MACD rolling back down
DI- overtaking DI+ with rising ADX
That would reestablish daily bear flag conditions from below.
🎯 Bottom Line
We are:
Inside a newly forming bull flag
Anchored at 681.55 (2/19)
Inside a larger multi-month chop range
Inside a daily and weekly squeeze
In a regime that punishes premature conviction
This week is about whether the 681.55 low becomes the foundation for expansion — or just another failed attempt.
If it breaks, it should break with momentum confirmation.
If it fails, it should fail fast.
