
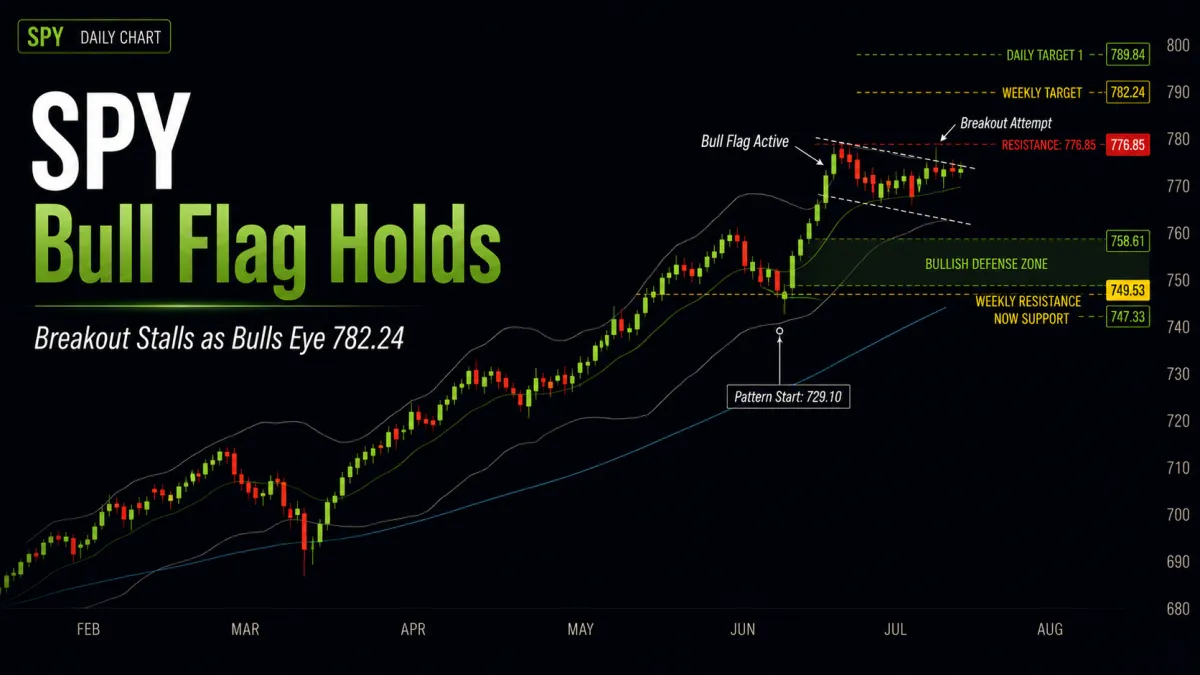
SPY Bull Flag Holds as Markets Consolidate Below Weekly Target

📆 DAILY CHART OUTLOOK — SPY
Week of August 17, 2026
The daily bull flag remains active, but the breakout is not yet cleanly underway.
Last week we cautioned against rushing the initial move through 776.85. Price was already extended after the prior week’s rally, and the Bollinger Bands needed time to widen before SPY could sustainably move toward its next targets.
That’s largely what happened.
SPY spent the beginning of the week moving sideways while the bands expanded, then finally broke above bull flag resistance Thursday.
But buyers couldn’t immediately follow through.
Friday closed back beneath 776.85, leaving SPY consolidating directly underneath resistance and keeping us in the same basic position:
the larger structure remains bullish, but the market still needs to prove it is ready for the next leg higher.
⸻
📌 Pattern State
Pattern State: Bull Flag Active
Pattern Start: 729.10 (7/29 low)
Low Anchor: 729.10 (7/29 low)
High Anchor: 776.85 (8/5 high)
Active Bull Flag Levels
0% Support: 729.10
38.2% Flag Support: 747.33
61.8% Flag Support: 758.61
100% Resistance: 776.85
127.2% Target 1: 789.84
161.8% Target 2: 806.36
Current Mode: Bull flag active, technical breakout attempted, but continuation remains unconfirmed after Friday closed back below 776.85.
Structural Invalidation: A close below 747.33 would break the lower boundary of the bull flag defense structure and materially weaken the current bullish pattern.
⸻
🔄 Structural Sequence — What Happened
1️⃣ Monday Through Wednesday — Consolidation
The first three sessions of last week were largely sideways.
After the powerful move from the prior week, this was constructive.
Rather than immediately chasing higher while already extended, SPY allowed the Bollinger Bands to begin expanding and creating additional room above price.
The bull flag remained intact throughout this consolidation.
⸻
2️⃣ Thursday — Resistance Breaks
Thursday finally produced the breakout attempt.
SPY gapped higher and pushed through the bull flag’s 776.85 resistance level.
Technically, that put the breakout into effect.
But as we cautioned last week, simply trading through resistance wasn’t enough.
We needed follow-through.
⸻
3️⃣ Friday — Breakout Stalls
Friday failed to provide that continuation.
Price remained near the highs but closed back below 776.85, putting SPY directly back into consolidation beneath resistance.
That doesn’t invalidate the bull flag.
It simply means the market hasn’t proven yet that buyers have enough immediate strength to sustain the next expansion higher.
⸻
📐 Immediate Structure Map
The setup remains straightforward.
Bull Flag Resistance
776.85
This remains the immediate level bulls need to reclaim and hold.
Weekly Target
782.24 — Weekly Target 1
This is now extremely close.
The daily Bollinger Bands have widened enough that SPY has room to reach this level without the same degree of extension we were dealing with one week ago.
Daily Targets
789.84 — Daily Target 1
806.36 — Daily Target 2
The first daily target is also becoming technically accessible as the bands continue widening.
Bullish Defense Zone
758.61 — Upper Flag Support
747.33 — Lower Flag Support
Former weekly resistance at 749.53 remains directly inside the lower portion of this structure.
That creates a particularly important support cluster between roughly 747 and 759 if price pulls back.
⸻
🔍 Momentum Context
The daily momentum picture remains strongly bullish.
• MACD remains bullish and above the zero line
• DI+ remains firmly above DI-
• ADX continues supporting the trend
• TTM Squeeze momentum remains strongly positive
• RSI remains bullish
• price remains well above the major breakout area
More importantly, the Bollinger Bands have now begun making the room we wanted to see.
That improves the probability that another attempt through 776.85 can travel farther than last week’s initial breakout.
But the market still has to do it.
Friday’s inability to continue higher tells us not to assume that move has begun simply because the indicators remain bullish.
⸻
⚠️ The Question This Week
There are two reasonable paths from here.
1️⃣ Bulls Push First
If SPY retakes 776.85 and buyers follow through, the first weekly target at 782.24 becomes the immediate objective.
With the Bollinger Bands widening, a continued move toward the first daily target at 789.84 is also possible.
But that would likely leave SPY increasingly extended again.
If price pushes first, expect another consolidation or pullback to follow before the larger move toward the 800 area develops.
2️⃣ Consolidation Deepens First
The alternative is that sellers continue defending the current resistance area.
That could send SPY back toward the bullish defense zone between 758.61 and 747.33.
There’s nothing inherently bearish about that scenario.
As long as buyers continue defending that structure, a pullback would simply provide the market with more attractive prices and additional room before another attempt higher.
⸻
🧭 What Happens Next
1️⃣ Can SPY Reclaim 776.85?
That’s the first question.
A sustained move through resistance puts 782.24 directly in play.
2️⃣ Does 782.24 Become Resistance?
The weekly chart is already suggesting that some resistance around this target should be expected.
If price reaches it, watch the intraday reaction carefully rather than assuming SPY immediately continues toward 789.84.
3️⃣ If Price Pulls Back, Does the Defense Zone Hold?
The 758.61–747.33 area remains the important bullish defense zone.
Holding that structure keeps buyers firmly in control of the active bull flag.
4️⃣ Which Comes First?
That’s really the question for this week:
Does SPY reach the weekly target before cooling off, or do sellers force the pullback first?
We don’t need to guess.
Intraday price action will tell us.
⸻
🎯 Bottom Line
The daily bull flag remains active.
Pattern Start: 729.10
Low Anchor: 729.10
High Anchor: 776.85
Last week’s technical breakout above 776.85 failed to immediately produce continuation, leaving SPY consolidating directly beneath resistance.
But unlike last week, the Bollinger Bands have now expanded enough to create room toward the 782.24 weekly target and potentially the 789.84 first daily target.
So the bullish roadmap remains intact.
If buyers push first, look toward 782.24, then potentially 789.84, while remaining aware that another consolidation will likely follow.
If sellers win the immediate battle, watch the 758.61–747.33 bullish defense zone for buyers to step back in.
Either path can still resolve higher.
The question isn’t whether we should guess which one happens first.
It’s whether price gives us the confirmation to follow it.
Until then, intraday price action leads the way.
