SPY Bull Flag On Watch as Market Coils Beneath Resistance
📆 DAILY CHART OUTLOOK — SPY
Week of July 6, 2026
The daily chart is still in consolidation, but the structure has shifted again.
Over the last few weeks, the market has repeatedly tried to establish one pattern only to invalidate it almost immediately:
first a bear flag formed and failed
then a bull flag formed and failed
then a new bear flag formed and failed again last week
That repeated formation-and-invalidation behavior is exactly what consolidation phases tend to look like.
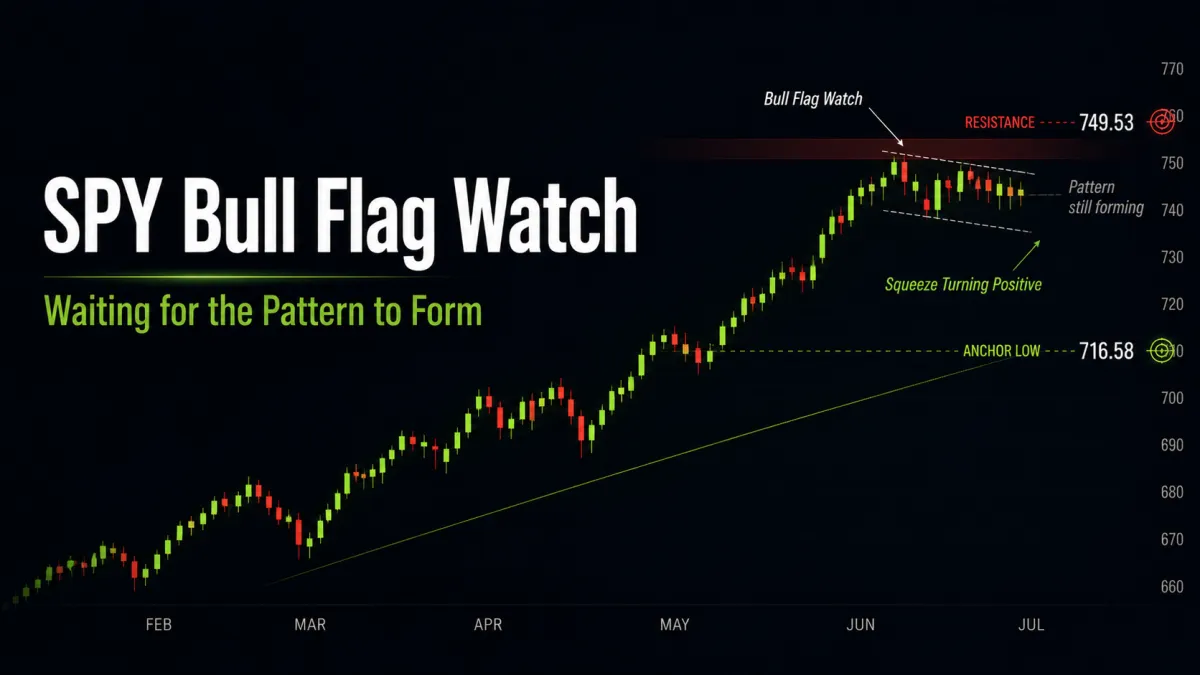
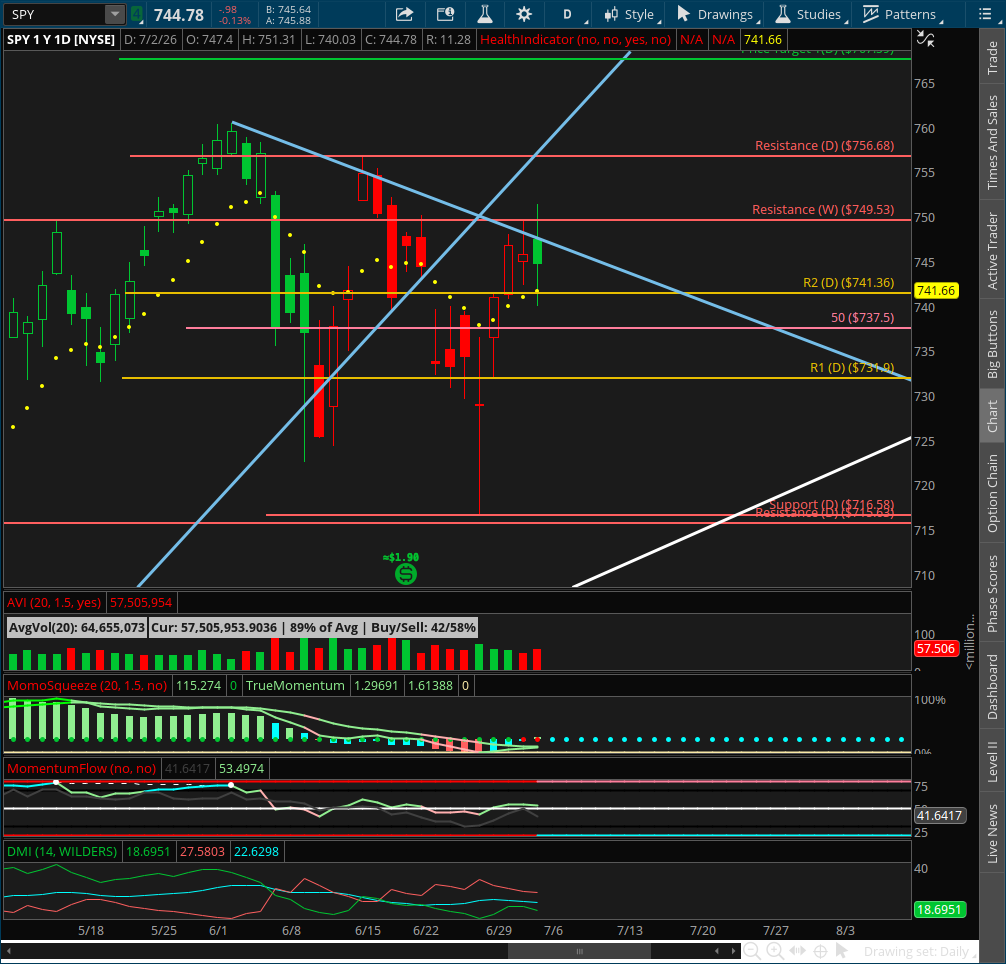
Now, with the latest bear flag invalidated, the market is back on bull flag watch as price tests the recent downtrend line.
That is the key point now:
there is still no active completed bull flag yet, but the chart is increasingly behaving like a market preparing for the next upside leg once the new structure fully forms.
⸻
📌 Pattern State
Pattern State: Bull Flag Watch
Pattern Start: 716.58 (6/26 low)
Anchor High: Not yet established
Trigger: Bull flag formation remains underway until price prints the first lower high and lower low, which will establish the new pattern high and defense structure
⸻
🔄 Structural Sequence (What Happened)
1️⃣ Monday — Bear Flag Established
Monday rebounded sharply off the prior Friday’s long-tail doji candle and printed a higher high and higher low.
That move established the newly formed bear flag and pushed price right up toward its invalidation level.
The close finished just shy of that invalidation level at 741.36, with price ending the day around 741.
⸻
2️⃣ Tuesday — Bear Flag Invalidated
Tuesday opened higher and pushed up through the invalidation level.
Price closed the day just below weekly resistance, but the move was enough to invalidate the newly formed bear flag and immediately shift the market back onto bull flag watch.
That was the second time in recent weeks that a bearish structure failed quickly instead of resolving lower.
⸻
3️⃣ Wednesday — Higher High and Higher Low Again
Wednesday printed another higher high and higher low, but the candle body stayed within Tuesday’s range.
That kept the market moving in the right direction for bullish structure, while still not giving us the lower-high / lower-low sequence needed to complete the new bull flag.
⸻
4️⃣ Thursday — Outside Bar, Bull Flag Still Forming
Thursday printed an outside bar, making both a higher high and a lower low.
That is important because it means the market is still in bull flag formation, not yet in a completed bullish pattern.
At the same time, price tested the recent bearish downtrend line and so far rejected there, which is exactly the kind of behavior we should expect while a new structure is still forming.
⸻
5️⃣ Friday — No Market Session (Independence Day Holiday)
Markets were closed Friday for the July 4th holiday.
That leaves the daily chart entering this week with a newly forming bull flag still on watch, but not yet fully established.
⸻
📐 Immediate Structure Map
The market is now trying to form a new bull flag just below key weekly resistance.
Key levels now in play:
Resistance / Breakout Area
recent downtrend line
weekly resistance near 749.53
developing but not yet fixed bull-flag high
Support
716.58 (anchor low from 6/26)
recent higher-low structure above that zone
As long as price continues to hold above recent lows, the new bull flag remains in formation.
The next critical structural event is the first true lower high and lower low, which will define the new pattern high and support band.
⸻
🔍 Momentum Context
Momentum is improving.
• prior bearish pattern invalidated
• price is now pressing into the recent downtrend line
• the market is forming a squeeze just below weekly resistance
• TTM Squeeze flipped positive last week
That last point matters most.
We specifically said that a flip back to positive would be one of the clearest signs that the market was getting ready to break out of this broader consolidation phase.
That signal has now arrived.
The only missing piece is the actual bull flag completing first so the breakout has a clean structure behind it.
⸻
⚠️ Important Structural Note
This is still a patience pays phase.
The market is acting constructively, but it is not yet giving the cleanest swing trigger.
There are two likely paths from here:
1️⃣ Bull Flag Forms Soon, Then Breaks Higher
If price continues holding above recent lows, the new flag should form soon.
That would likely mean a bit more sideways consolidation first, followed by a breakout above the newly established pattern high.
This is the cleaner bullish path.
2️⃣ Price Keeps Chopping Before the Flag Fully Forms
The other possibility is that the market remains noisy and keeps rotating around the downtrend / weekly resistance area before the pattern fully completes.
That would still fit the broader consolidation theme, just with more chop before resolution.
Either way, the market is behaving more like a chart preparing for a bullish breakout than one setting up for a deeper bearish continuation.
⸻
🧭 What Happens Next
Going into this week, the key questions are:
1️⃣ Does Price Hold Above 716.58?
As long as price holds above the recent low, the new bull flag remains in formation and the constructive case stays alive.
2️⃣ Does the New Bull Flag Finally Complete?
That happens once price prints the first lower high and lower low, which will define the pattern and give us the clean breakout structure to monitor.
3️⃣ Does the Squeeze Follow Through?
The TTM Squeeze has already flipped positive.
If price can now complete the bull flag and break higher, that would strongly support a breakout from this broader consolidation phase.
⸻
🎯 Bottom Line
The daily is still in consolidation, but the path is improving for the bulls.
The most recent bear flag failed, price is back on bull flag watch, the 6/26 low at 716.58 remains the key anchor low, and the market is now forming a squeeze just below weekly resistance.
That does not mean jump early.
It means be ready.
So for now:
a new bull flag is forming
the anchor low is 716.58
the anchor high is not set yet
the TTM Squeeze flipping positive is a bullish clue
and until the new flag fully forms, intraday price action and ORBI still lead the way
This is a market that looks like it wants higher prices later.
Now we wait for it to finish building the structure first.
