SPY Presses Higher as Bulls Stay in Control

📆 DAILY CHART OUTLOOK — SPY
Week of April 27, 2026
The daily chart remains in full upside expansion mode.
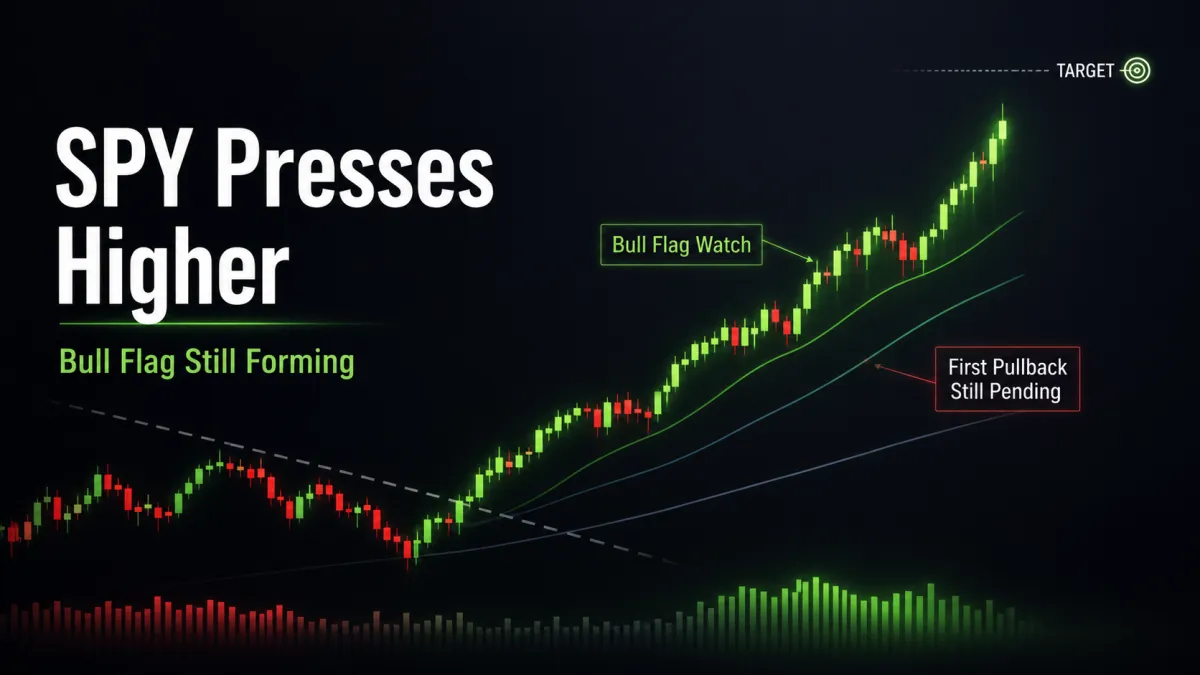
Last week we were still on bull flag watch, waiting for the first real pullback that could establish the new pattern.
That still has not happened.
Price continued higher all week, kept pressing new highs, and never produced the first lower high and lower low needed to complete the pattern.
So the bullish structure remains in its forming stage, not its established stage.
⸻
📌 Pattern State
Pattern State: Bull Flag Watch
Pattern Start: 651.06 (4/7 low)
Anchor High: Not yet established
Trigger: Bull flag formation requires the first lower high and lower low to form while price holds above its eventual 38.2% retracement and the 100SMA / prior breakout zone
⸻
🔄 Structural Sequence (What Happened)
1️⃣ Monday — Inside Bar, Expansion Pauses
Monday printed an inside bar.
That gave the market a brief pause, but not a pullback.
The move stayed in expansion mode and did not yet create the structure needed to establish the bull flag.
⸻
2️⃣ Tuesday — Outside Bar, Volatility Expands
Tuesday printed an outside bar.
That kept the move in active expansion and showed that volatility was continuing to widen rather than contract into a clean pattern.
The bull flag still did not form.
⸻
3️⃣ Wednesday — Higher Highs and Higher Lows
Wednesday continued the move with higher highs and higher lows.
That kept the same bullish sequence intact and confirmed buyers were still pressing the trend rather than giving back ground.
⸻
4️⃣ Thursday — Another Outside Bar
Thursday again printed an outside bar.
Price kept testing new highs and continued expanding rather than pulling back into a consolidation structure.
That meant the market still had not built the first completed pullback needed for the new bull flag.
⸻
5️⃣ Friday — Higher Highs and Higher Lows Again
Friday finished the week with another higher high and higher low.
That kept the current bullish move in full expansion mode into the close.
The pattern remains on watch, but is still not established.
⸻
📐 Immediate Structure Map
The current move remains bullish, but the market is now extended and the next important event is still the first meaningful pullback.
Key levels now in play:
Support / Pullback Levels
697.84 (previous ATH)
689.7 (monthly resistance)
100SMA
50SMA
Upside Objective
716.3 (first weekly target)
As long as price remains above the breakout area and the key moving averages, the bullish structure remains intact.
⸻
🔍 Momentum Context
Momentum remains strong.
• Bollinger Bands have created room for the move
• RSI remains above 70 and continues pressing off overbought
• Momentum is still aligned higher across timeframes
• Price continues making new highs with strength
That suggests the move may still complete to the first weekly target at 716.3 before the first real pullback arrives.
That is not guaranteed, but it is currently the path of strongest momentum.
⸻
⚠️ Important Structural Note
We still do not have a completed bull flag.
The same bull flag watch remains active because price has not yet produced the first lower high and lower low needed to establish the pattern.
That means the market is still in the expansion phase, not the pattern phase.
Also important:
The 50SMA is still below the 100SMA
We want to see that cross back bullish
That would add another strong layer of confirmation that this new larger structure is capable of producing continued 52-week highs
Until then, the trend is strong, but the next pullback remains important.
⸻
🧭 What Happens Next
Going into this week, the key questions are:
1️⃣ Does Price Reach 716.3 Before Pulling Back?
With momentum still strong and RSI continuing to press overbought, the first weekly target at 716.3 remains a realistic near-term objective.
2️⃣ When Do We Get the First Lower High and Lower Low?
That remains the next structural event we are waiting for.
Until that happens, the bull flag remains in formation only.
3️⃣ Where Does the Pullback Find Support?
When the pullback does arrive, the most relevant levels are:
697.84
689.7
100SMA
50SMA
That cluster now becomes the key area to judge whether the next pattern is healthy.
⸻
🎯 Bottom Line
The daily chart remains in upside expansion mode.
Last week did not produce the first completed pullback needed to establish the new bull flag.
Instead, price continued pressing higher, kept momentum aligned, and remains on track toward the 716.3 weekly target.
So for now:
Bulls remain in control
Momentum is still strong
Price is extended
The first real pullback is still the next event to watch
Until that pullback forms, intraday opportunities with ORBI remain the primary focus while we wait for the next clean pattern to develop.
