SPY Traps Both Sides Again — New Bull Flag Forms Inside Tight Compression

📆 DAILY CHART OUTLOOK — SPY
Week of February 9, 2026
Last week was another masterclass in whipsaw — a perfect reflection of the current low-conviction, high-volatility environment.
Markets entered the week holding above key levels, continuing the bull flag we were monitoring. But by Thursday, the pattern was broken — only to be followed by a violent Friday rally that invalidated the newly formed bear flag just as quickly. We’re now back inside the range, only it's a little wider, with a new squeeze forming and a new bull flag possibly starting to build.
🔄 Recap of Last Week
Monday: Opened a bit lower, rallied strong, and closed near highs — continued the active bull flag structure.
Tuesday: Gapped up but reversed sharply, losing 689.7 intraday and closing back inside the consolidation zone.
Wednesday: Intra-zone chop. Opened above 689.7, dipped below 683.67, bounced to the 50SMA, then closed weak.
Thursday: Breakdown. Gapped lower, sliced through 683.67, 100SMA, and bull flag support, closing well outside the lower Bollinger Band at new local lows — officially invalidating the active bull flag.
Friday: Massive reversal. Price gapped down slightly, then exploded upward all day. Closed back above 689.7, canceled the nascent bear flag structure, and began the formation of a new bull flag.
Thursday's low at 675.79 now serves as the base of this new structure. Whether the high of this new pattern is in depends on what happens early this week — especially with overhead resistance tightening.
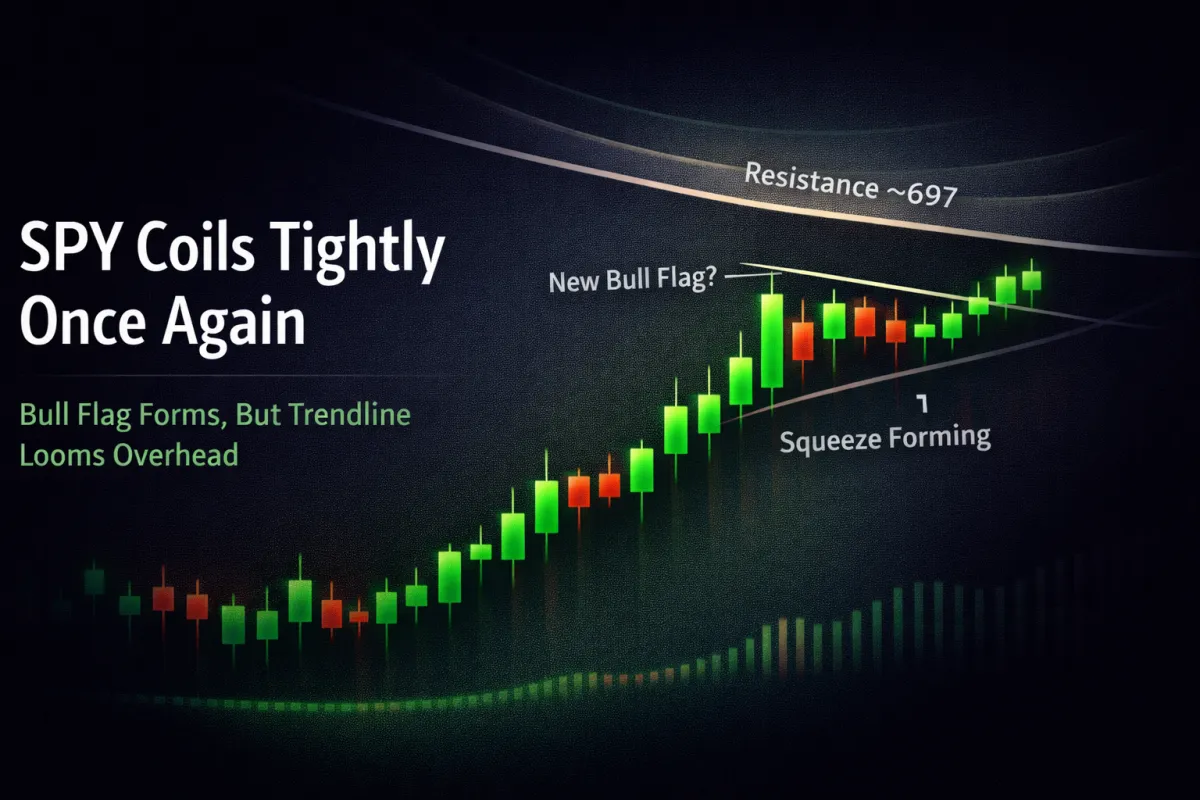
⏳ Current Structure = Early Bull Flag + Squeeze
We are now watching the early formation of a new bull flag.
Low: 675.79 (Thursday)
High: TBD — Friday’s high is a candidate, but not confirmed yet, must see both a lower high and low print on daily first to confirm.
Compression Zone: Price is now wedged between:
683.67 (reclaimed resistance)
692.6 (first target from invalidated flag)
Downtrend line from previous highs (getting tighter)
Above that, 697.84 is the high and key resistance to clear.
The daily squeeze is now fully formed, with histogram rolling negative and momentum flow starting to fade — compression is building, but direction isn’t confirmed yet.
🧭 What to Watch This Week
🔼 Bullish Path: New Flag Builds + Breakout
If price continues forming higher lows and higher highs, we’ll confirm a new active bull flag.
A breakout above 697.84 (prior high) would show strength and could launch a move toward 703.95 (prior bull flag target) and even 711.15 (Major PT2).
This would likely require a clear squeeze release and expanding momentum — without it, upside will remain grindy and vulnerable.
A proper pullback (lower high/low) after a test of that resistance level could set the stage for a much more sustainable next leg up.
🟧 Most Likely: Push Higher Into Resistance, Then… Fade or Break?
After Friday’s explosive rally, early-week continuation is likely.
But the trendline resistance just overhead could cap that strength quickly.
Watch for a higher high early in the week — ideally a push just above 697.84, even if it doesn’t close above.
If that happens, the structure becomes more bullish and the launchpad cleaner — a breakout from there would have legs.
But if the move stalls at the trendline and momentum fades, the next key question is:
Do we consolidate and digest the move?
Or do we fade hard and retest support?
A light pullback and chop could still set up a breakout later in the week.
A sharp selloff would likely bring 675.79 back into play — and raise the odds of a deeper retrace.
🔻 Bearish Scenario: Rejection + Breakdown
Less likely after Friday’s rally, but still possible:
If markets reverse hard Monday and fail to push higher at all, we could remain trapped in the chop zone between 683.67 and 689.7.
In that case, expect sideways action early, then renewed selling pressure mid-to-late week.
If 675.79 breaks again, watch:
First: 671.13
Then: 663.39
Bear flag targets technically remain valid, since that flag’s high still hasn’t been broken.
But Friday’s rally and overall bullish structure make those targets more difficult to reach cleanly, at least until the weekly squeeze rolls negative — which would signal a broader momentum shift.
🎯 Bottom Line
The previous bull flag is gone. The bear flag that followed is also gone.
We are now back in the middle of a tightening range, with a new bull flag structure possibly forming and a daily squeeze compressing the next move.
Friday’s move was aggressive — so was Thursday’s.
This market still punishes late conviction and rewards patience.
Stick to:
High-quality intraday setups (ORBI, strong momentum names)
Swing trades with clear structure and confirmed entries
Letting the squeeze resolve before taking size
Avoid:
Swinging the index unless the structure is clean
Chasing breakouts without volume or follow-through
Getting emotional inside chop
→ Let the new bull flag prove itself
→ Let price test the highs before deciding
→ And above all, don’t guess — wait for confirmation
