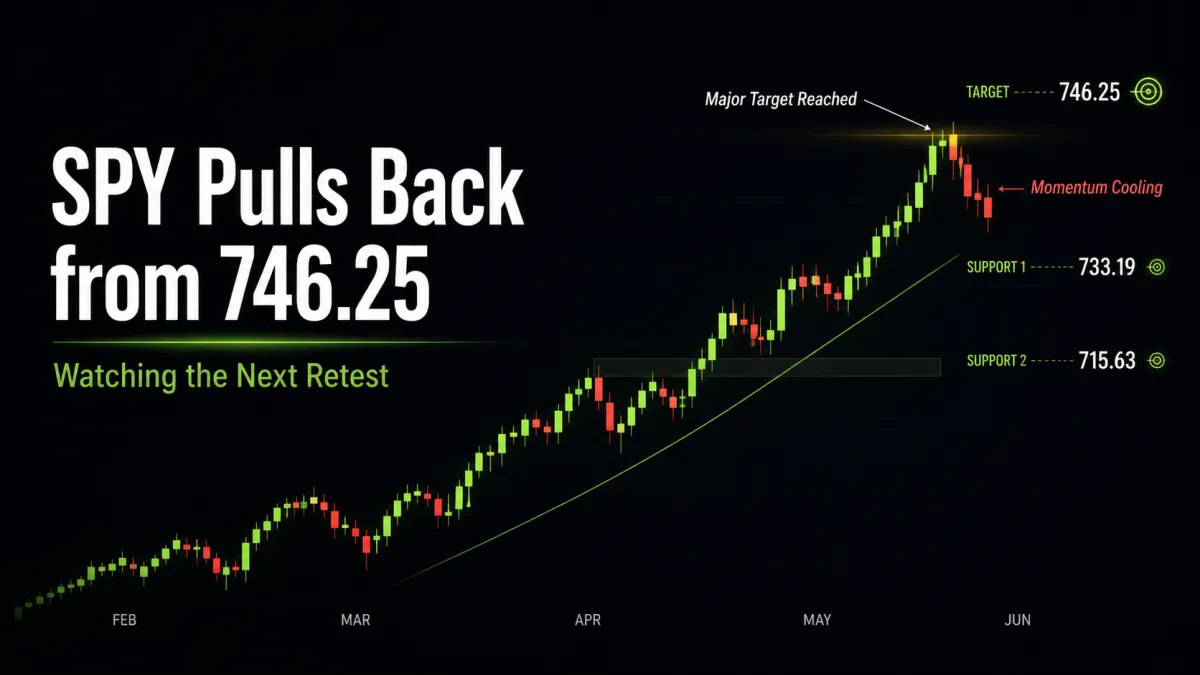
SPY Pulls Back from 746.25 as Bullish Momentum Begins to Cool
📆 DAILY CHART OUTLOOK — SPY
Week of May 18, 2026
The daily chart remains bullish, but the character of the move is starting to change.
Last week, price continued pushing higher and completed the move into the major higher-timeframe target zone we had been watching. That kept the active bull trend intact, but Friday finally showed the first real cooling after a long stretch of overbought expansion.
That does not mean the trend has failed.
What it does mean is that this move is likely getting close to the point where a pullback or retest becomes more likely than clean further expansion from here.
⸻
📌 Pattern State
Pattern State: Bull Flag Active
Pattern Start: 651.06 (4/7 low)
High Anchor: 715.63 (4/28 high)
Trigger: Thursday, 5/1 breakout above 715.63 confirmed continuation from the active bull flag
⸻
🔄 Structural Sequence (What Happened)
1️⃣ Monday — Higher High and Higher Low
Monday opened flat but still produced both a higher high and higher low.
That kept the active bullish structure intact and showed buyers were still controlling the tape even without a strong opening push.
⸻
2️⃣ Tuesday — Retest of 733.19 Holds
Tuesday opened slightly lower and pulled back to retest the move above 733.19.
That retest held.
Price found support there and pushed back toward the highs into the close, which kept the continuation structure healthy.
⸻
3️⃣ Wednesday — Uptrend Restarts
Wednesday opened flat and then pushed higher again.
That session resumed the trend with another higher high and higher low, confirming that bulls were still able to reassert control after the prior day’s retest.
⸻
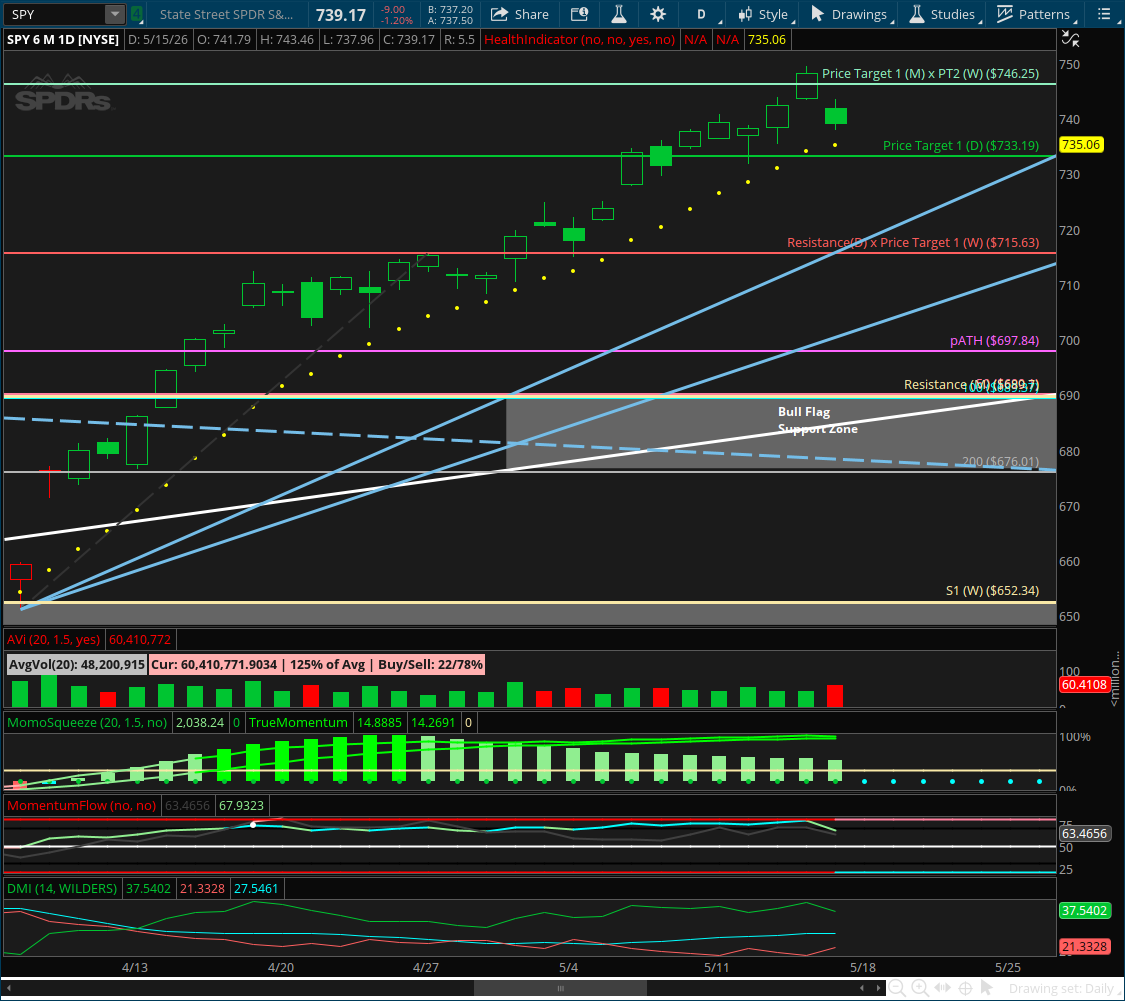
4️⃣ Thursday — Major Weekly Target Reached
Thursday’s continuation pushed price into the next major target zone at:
746.25
That was the second major weekly target and the key higher-timeframe area we had been watching for a likely short-term top zone.
⸻
5️⃣ Friday — First Real Pullback from Target Zone
Friday pulled back from that major target area, specifically from the zone between:
746.25
755.53
That was expected.
Importantly, though, the daily trend has not failed yet.
Price is still holding above the 10EMA, and RSI has finally started cooling after a long expansion phase in overbought territory.
⸻
📐 Immediate Structure Map
The active bullish structure remains in place, but price is now much more likely to need a retest than it was a week ago.
Key levels now in play:
Resistance / Target Zone
746.25
755.53
Support / Retest Levels
10EMA
733.19
715.63 (major breakout level, still not retested since price moved to targets)
As long as price remains above the support stack, the active structure remains bullish.
⸻
🔍 Momentum Context
Momentum is still bullish overall, but it is no longer in the same effortless expansion phase.
• DMI remains bullish
• MACD remains bullish
• Price is still above the 10EMA
• RSI has cooled from overbought after a long upside expansion
• The move has now reached a major resistance / target area
That combination says the trend is still intact, but the market is likely running low on room for immediate continuation without first resetting.
⸻
⚠️ Important Structural Note
The biggest thing to understand now is this:
The move has not failed, but it is likely nearing the end of this current leg.
That means the most relevant question is no longer “can bulls keep pushing right now?”
It is:
Where does the next pullback find support, and does that retest hold?
The first major level below that stands out is:
715.63
That breakout level has not been retested since price moved to targets, and it is not unlikely that the market rotates back there in the near future if this cooling phase continues.
That would be a normal and healthy retest if it happens.
⸻
🧭 What Happens Next
Going into this week, the key questions are:
1️⃣ Does Price Hold the 10EMA?
As long as price continues holding above the 10EMA, the trend is still technically alive and a move to the second daily target remains possible.
2️⃣ Does the Pullback Deepen into a Real Retest?
If this cooling continues, the most important retest zone becomes:
733.19
then potentially 715.63
That is where we would expect stronger support to matter most.
3️⃣ Is This Broad Trend Continuation or Rotation?
From here, broad index continuation looks less attractive than it did a week ago.
That means focus may shift more toward:
intraday opportunities
relative strength in other tickers
possible sector rotation
But those setups should still be treated carefully, because some “strong” names from here may simply be laggards catching up rather than true new leadership.
⸻
🎯 Bottom Line
The daily trend is still bullish, but this move is likely nearing the end of its current leg.
Price reached the major target zone at 746.25, pulled back from it, and is now finally starting to cool after a long overbought expansion.
That does not mean the trend is over.
It does mean this is no longer the cleanest place to press fresh long exposure on the index itself unless there is clear room and very obvious setup quality elsewhere.
So for now:
Bulls still control the broader trend
The 10EMA is the immediate line in the sand
A retest of 715.63 is increasingly plausible
Focus is beginning to shift from broad trend continuation toward more intraday-scoped execution
