SPY Cooling Off After the Run, 715.63 Now Matters Most

📆 DAILY CHART OUTLOOK — SPY
Week of June 8, 2026
Last week’s daily chart did exactly what we had been warning about.
The market was overbought, extended, and still grinding higher, but only until weakness showed up. That weakness finally arrived, and by Friday the short-term continuation phase had clearly broken.
The key change now is this:
There is no active bullish pattern anymore.
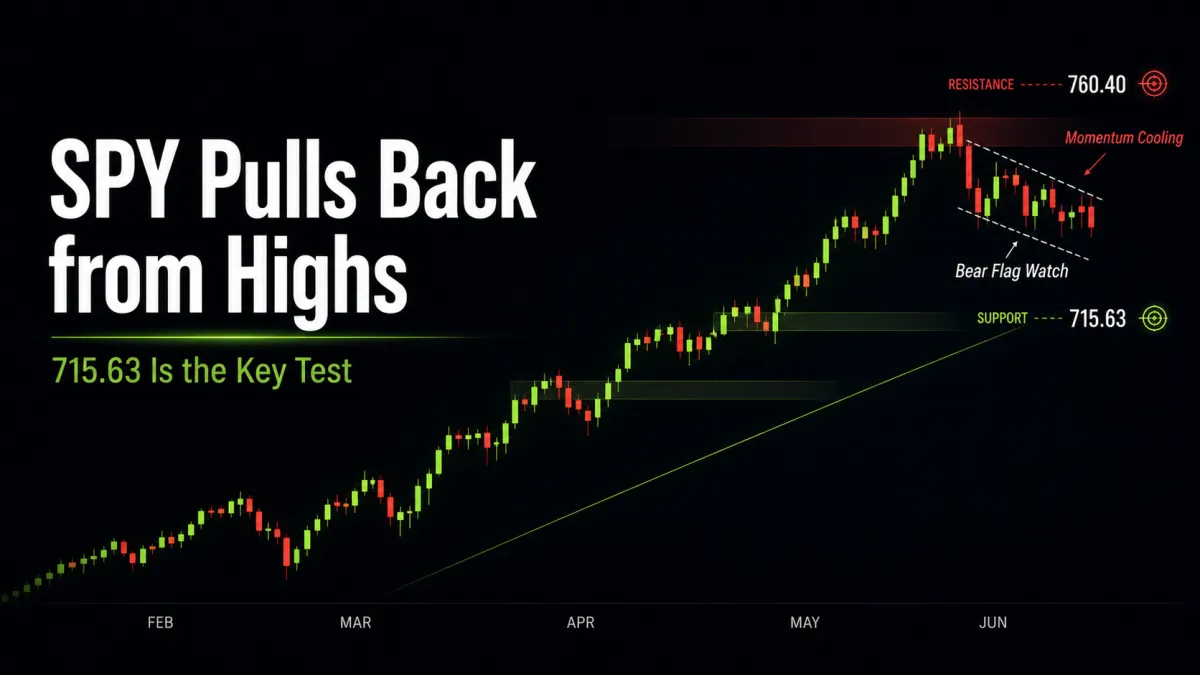
That smaller bullish structure that had been forming under weekly resistance was invalidated Friday, and we are now on watch for a newly forming bear flag with its anchor high set at 760.40 on 6/2.
⸻
📌 Pattern State
Pattern State: Bear Flag Watch
Pattern Start: 760.40 (6/2 high)
Anchor Low: Not yet established
Trigger: Bear flag formation remains underway as long as price continues printing lower highs and lower lows, and only ends once a higher high and higher low print
⸻
🔄 Structural Sequence (What Happened)
1️⃣ Monday — Higher High, Outside Bar
Monday printed a higher high and an outside bar as price extended beyond the second daily target.
That was the kind of extension we had been highlighting as likely near the end of this leg, and as the place where resistance was most likely to show up.
⸻
2️⃣ Tuesday — Higher High and Higher Low, but Inside Monday’s Range
Tuesday still printed a higher high and higher low, but most of the session stayed contained within Monday’s range.
That was the first sign that momentum was no longer expanding cleanly even though price was still technically pushing higher.
⸻
3️⃣ Wednesday — Pullback Begins, 10EMA Still Holds
Wednesday gapped down and pulled back, but price still held above the 10EMA (D).
At the same time, RSI had already begun pulling out of overbought territory and started showing bearish divergence, while price was trying to maintain a small bullish structure above weekly resistance.
That was the early warning phase.
⸻
4️⃣ Thursday — Gap Below 10EMA, Bounce into the Close
Thursday gapped lower below the 10EMA, then bounced back toward Wednesday’s highs into the close.
That bounce helped the smaller bullish structure hold for one more day, but by then the market was already showing clear instability after such an extended run.
⸻
5️⃣ Friday — Breakdown, Pattern Invalidated
Friday gapped lower again, and this time the market lost:
weekly resistance
the 10EMA (D)
and the smaller bullish pattern entirely
Price sold off through the session on strong volume, which effectively obliterated the small bullish pattern.
That leaves us with no active pattern and puts the market on watch for a newly forming bear flag from the 6/2 high at 760.40.
⸻
📐 Immediate Structure Map
With no active completed bearish pattern yet, the most useful near-term guide remains the prior major daily stack.
Key levels now in play:
Near-Term Resistance
760.40 (new bear flag watch anchor high)
recent broken highs / failed continuation zone
Support / Retest Levels
715.63 (major daily breakout level)
50SMA
below that, broader weekly support band
As long as price continues making lower highs and lower lows, the new bearish structure remains in formation.
⸻
🔍 Momentum Context
Momentum has clearly cooled.
• RSI pulled out of overbought
• Bearish divergence showed up before the break
• 10EMA was lost
• Friday selloff came on strong volume
• Near-term momentum has shifted away from clean continuation
That does not mean the higher-timeframe bull trend is dead.
It means the daily now needs to either:
stabilize and cancel this newly forming bearish structure
or continue lower and complete it
⸻
⚠️ Important Structural Note
The most important level from here is still:
715.63
That remains the major daily breakout level.
But there are two realistic paths from here:
1️⃣ Early Bear Flag Failure
If price pulls back, stabilizes, and breaks the lower-high / lower-low sequence early, then this newly forming bear flag will likely fail before doing much damage.
That would keep this whole move in the category of normal consolidation before higher prices return.
2️⃣ Bear Flag Completes and Breaks Down First
The other possibility is that this newly forming bear flag completes relatively soon, then enters a short bearish consolidation phase before breaking its own support.
If that happens, the breakdown could target a move into the 715.63 retest zone, where buyers may finally step in.
In that case, the bear flag may not need to grow much larger before it becomes actionable. It may simply form, break down, hit targets into the breakout retest area, and only there find the support needed to end the bearish sequence.
That is why 715.63 remains the real line in the sand.
If that level holds, this likely remains a healthy reset inside a still-bullish larger trend.
If it fails, then attention shifts toward the 50SMA and potentially the broader weekly support band.
⸻
🧭 What Happens Next
Going into this week, the key questions are:
1️⃣ Does Price Keep Printing Lower Highs and Lower Lows?
If yes, then the new bear flag continues forming and we get a much clearer read on where price is likely headed next.
2️⃣ Does Price Retest 715.63?
That is the biggest near-term level on the chart.
If price reaches it and holds, this likely stays a consolidation phase.
If it fails, deeper retracement comes into play.
3️⃣ How Does the New Bearish Structure Resolve?
There are three realistic outcomes for this newly forming bear flag:
Early cancellation: buyers step in before deeper support is reached, break the lower-high / lower-low sequence, and cancel the forming bear flag before it grows much further.
Completion then cancellation at support: the bear flag completes, breaks down, and moves to its downside targets, with that move carrying price into the 715.63 retest zone. If buyers hold that area, the bearish structure likely ends there and the market resets for another leg higher.
Breakdown through 715.63: if price loses the 715.63 area after that retest, then the pullback is likely becoming more than simple consolidation and the odds increase that price rotates deeper into the broader weekly support band.
⸻
🎯 Bottom Line
The daily has shifted.
The overbought grind higher ended, the smaller bullish pattern failed, and there is now no active bullish structure in play.
Instead, we are now watching a newly forming bear flag from the 6/2 high at 760.40.
That does not mean a broad correction is already underway.
It means the market is finally doing what extended markets often do, cooling off and forcing us to see whether support holds or the pullback deepens.
So for now:
near-term focus is on the forming bear flag
715.63 is the main line in the sand
if that holds, this is likely just consolidation
if it fails, deeper retracement comes into play
and until a new clean pattern forms, intraday focus matters more than forcing swing entries
