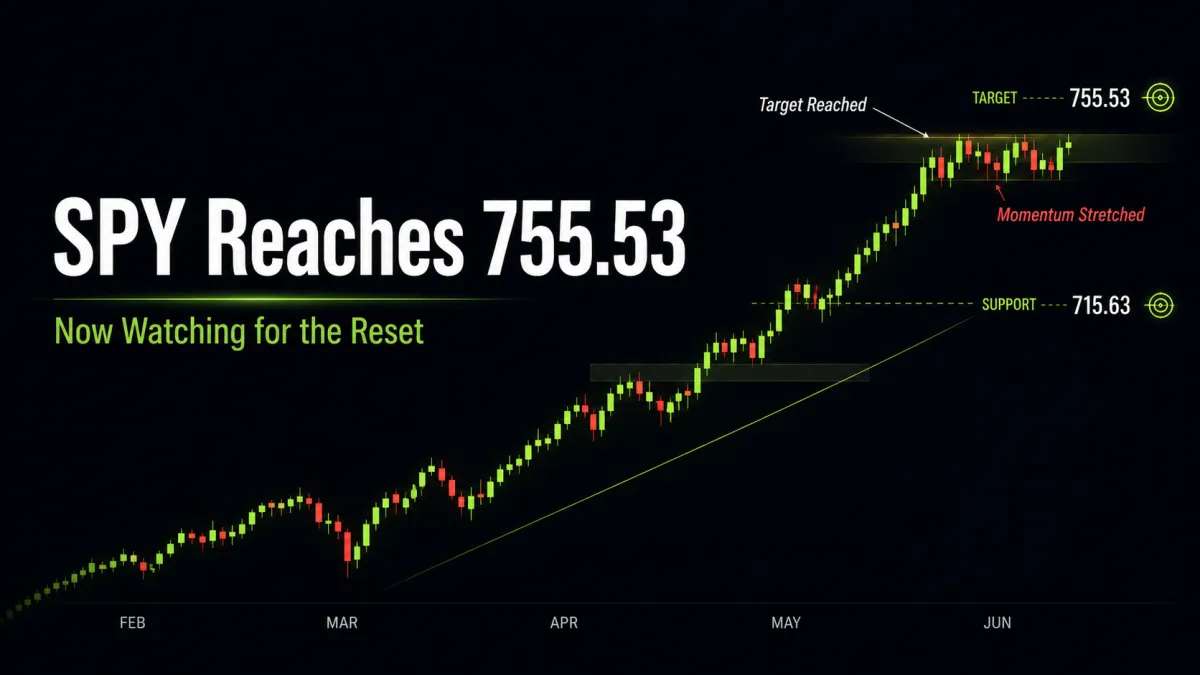
SPY Reaches 755.53 as Bullish Momentum Stretches
📆 DAILY CHART OUTLOOK — SPY
Week of June 1, 2026
The daily chart remains bullish, but this move is clearly getting mature.
Price completed the move to both daily targets last week, with the second target at 755.53 finally being reached on Friday. That keeps the larger bullish structure intact, but it also means the current leg has largely done its job.
At this point, the market is no longer in the cleanest place to be pressing fresh swing exposure on the index. Higher timeframes still suggest price likely continues higher over time, but the daily is now much more likely to need a cooling phase first before the next meaningful leg can begin.
⸻
📌 Pattern State
Pattern State: Bull Flag Active
Pattern Start: 651.06 (4/7 low)
High Anchor: 715.63 (4/28 high)
Trigger: Thursday, 5/1 breakout above 715.63 confirmed continuation from the active bull flag
⸻
🔄 Structural Sequence (What Happened)
1️⃣ Monday — No Market Session (Memorial Day)
Markets were closed Monday for Memorial Day, so there was no regular session price action.
That left the market heading into Tuesday still holding the prior breakout structure and the key levels we had already outlined.
⸻
2️⃣ Tuesday — Weekly Resistance Break Confirms Target Still in Play
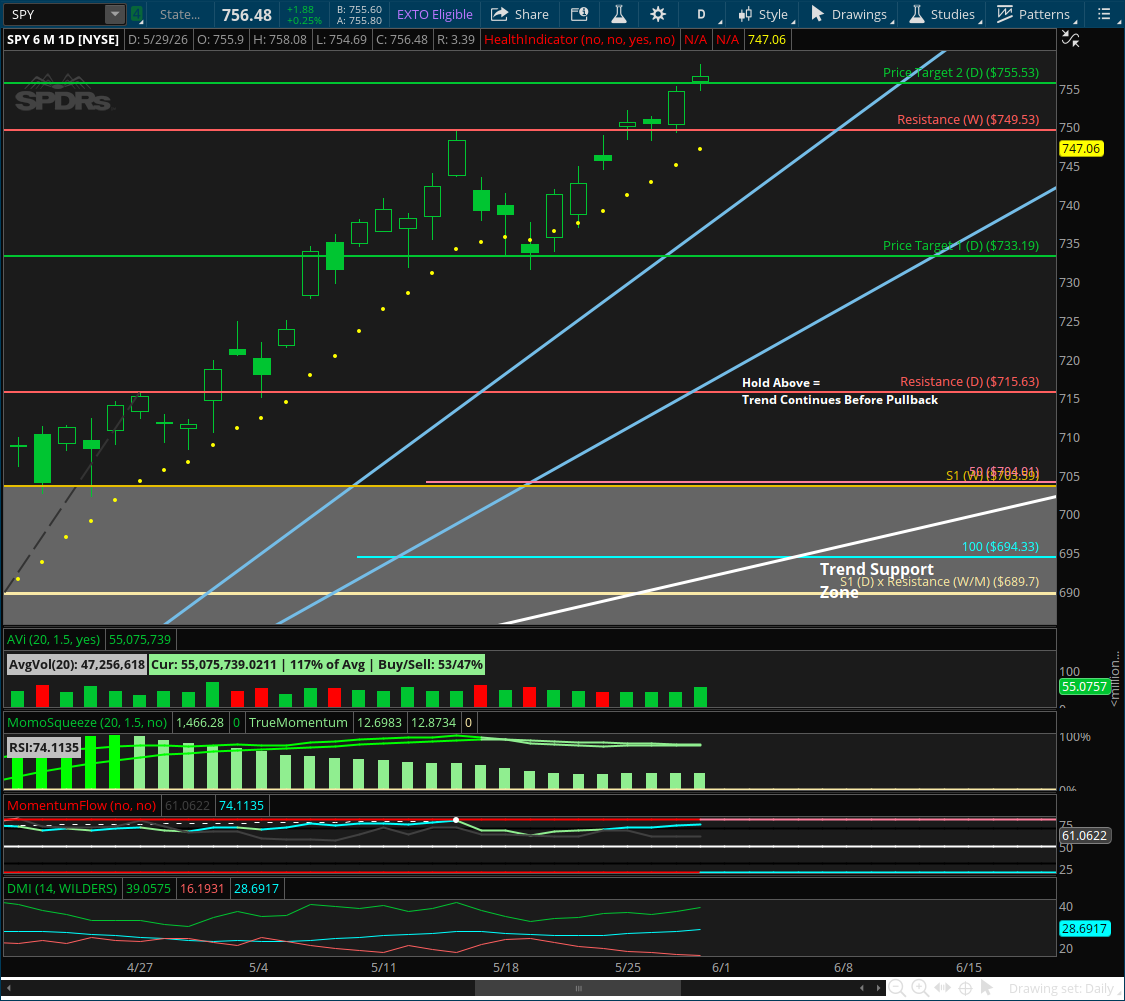
Tuesday opened above the previous Friday’s high and closed above the weekly resistance level at:
749.53
That was the level we were watching.
Its break and close above confirmed that the second daily target at 755.53 remained in play.
⸻
3️⃣ Wednesday — Consolidation Above Resistance
Wednesday consolidated above that newly reclaimed weekly resistance.
That mattered because price did not immediately reject the breakout. Instead, it held the level into the close and kept the continuation structure intact.
⸻
4️⃣ Thursday — Volatility Expands, Price Pushes Toward Target
Thursday price rallied and volatility expanded.
That push carried price right up toward the second daily target, coming just shy of 755.53 while keeping the trend firmly intact.
⸻
5️⃣ Friday — Second Daily Target Reached, Choppy Around the Level
Friday opened above the second daily target and spent the session chopping around that level.
That completed the move to:
755.53
Reaching that target confirms the continuation leg fully delivered to its intended objective, while also increasing the odds that the market now needs a pause, pullback, or consolidation before a fresh leg higher can develop.
⸻
📐 Immediate Structure Map
The daily pattern remains intact, but the move itself is now largely complete.
Key levels now in play:
Resistance / Completed Target Zone
755.53 (second daily target, now reached)
Immediate Support / Weakness Trigger
10EMA (D)
Broader Structural Support
715.63 (major daily breakout level)
daily / weekly trend support beneath if 715.63 fails
As long as price remains above the 10EMA and above the breakout stack, the broader bullish structure remains intact.
⸻
🔍 Momentum Context
Momentum is still bullish overall, but the market is stretched.
• RSI is now quite overbought and extended
• Higher timeframes remain bullish
• Daily SMAs are accelerating and back in their healthiest position
• The market still looks geared toward making new 52-week highs in the coming weeks and months
That is the important nuance:
The larger trend still favors higher prices over time, but the daily move itself now looks mature enough that a cooling period is more likely than another clean immediate expansion.
⸻
⚠️ Important Structural Note
The first thing to watch from here is:
loss of the 10EMA (D)
That would be the second meaningful sign of weakness and could open the door to a broader correction / consolidation pattern on the daily.
That would not automatically break the bigger bullish structure.
But it would likely mean the market needs to reset and that the next tradable leg higher will need a new daily pattern to form first.
The real line in the sand below remains:
715.63
As long as that level holds, the market is still structurally positioned for more 52-week highs in the coming weeks and months.
If that level fails, then attention shifts toward a deeper retracement into the broader support structure.
⸻
🧭 What Happens Next
Going into this week, the key questions are:
1️⃣ Does Price Hold the 10EMA?
As long as price holds the 10EMA (D) and stays above weekly resistance turned support, the market can still grind higher or move sideways while staying bullish.
2️⃣ Does a Cooling Phase Begin?
With the move now completed to target and price overbought across key timeframes, a period of consolidation is increasingly likely.
That would be healthy, not bearish by default.
3️⃣ Where Will the Next Real Swing Opportunity Come From?
Not from chasing up here.
The next meaningful swing opportunity is more likely to come from:
a pullback
a consolidation
and a new daily pattern forming that gives the market a second wind
Until then, the cleaner opportunities are more likely to stay intraday-focused.
⸻
🎯 Bottom Line
The daily trend is still bullish, but this leg is largely complete.
Tuesday’s break above 749.53 confirmed the second daily target remained in play, Wednesday held that breakout, Thursday pushed price to the edge of target, and Friday completed the move by opening above 755.53 and chopping around it.
That does not mean the larger trend is over.
It means patience matters here.
So for now:
Bulls still control the broader trend
10EMA (D) is the first warning line
715.63 remains the major structural line in the sand
The next good swing entry likely comes from a new pattern, not from chasing this completed leg
Intraday setups with ORBI are even more in focus from here
