SPY Recovery Attempt Begins, But the Bull Flag Still Needs to Form

📆 DAILY CHART OUTLOOK — SPY
Week of April 13, 2026
The daily chart is now shifting away from clean downside continuation and into the early stages of a potential recovery structure.
Last week, price rebounded sharply from the support zone, invalidated the previously active bear flag, and reclaimed both the 50SMA and 100SMA into the weekly close.
That does not mean the market is back in a clean bullish trend yet.
What it does mean is that the prior bearish structure is no longer in control, and we are now on bull flag watch beginning from the 4/7 low.
⸻
📌 Pattern State
Pattern State: Bull Flag Watch
Pattern Start: 651.06 (4/7 low)
Anchor High: Not yet established
Trigger: Bull flag formation requires price to set the first lower high and lower low while holding above its eventual 38.2% retracement and the 200SMA
⸻
🔄 Structural Sequence (What Happened)
1️⃣ Monday — Bear Flag Resistance Still in Play
Monday price continued battling with the previously established, but no longer dominant, bear flag resistance level at 656.07.
Price closed the day back inside that prior resistance band between the 61.8% and 38.2% retracement levels, showing the market was still working through overhead pressure early in the week.
⸻
2️⃣ Tuesday — Pullback Holds, Price Stays in the Band
Tuesday markets opened lower, pulled back, found support, and closed the day back inside that same resistance band.
That action showed the market was stabilizing rather than immediately rolling back over.
⸻
3️⃣ Wednesday — Gap Up Invalidates Prior Bear Flag
Wednesday, after news of a ceasefire between the USA and Iran, markets gapped up with force.
Price opened above the 50SMA, pulled back intraday, and still managed to close back above it.
That gap up officially invalidated the previous bear flag and shifted the market from bearish continuation into recovery mode.
⸻
4️⃣ Thursday — 100SMA Reclaimed
Thursday markets opened above the 50SMA and pushed higher into the close, reclaiming the 100SMA.
That was an important structural development because it put price back above both intermediate moving averages for the first time in several weeks.
⸻
5️⃣ Friday — 100SMA Holds into the Close
Friday opened higher, above the 100SMA, and spent the day testing that level.
By the close, price remained above it, confirming that the market ended the week holding both the 50SMA and 100SMA.
That keeps the recovery attempt alive going into this week.
⸻
📐 Immediate Structure Map
The prior bear flag is gone.
What matters now is whether price can transition from rebound into actual bullish structure.
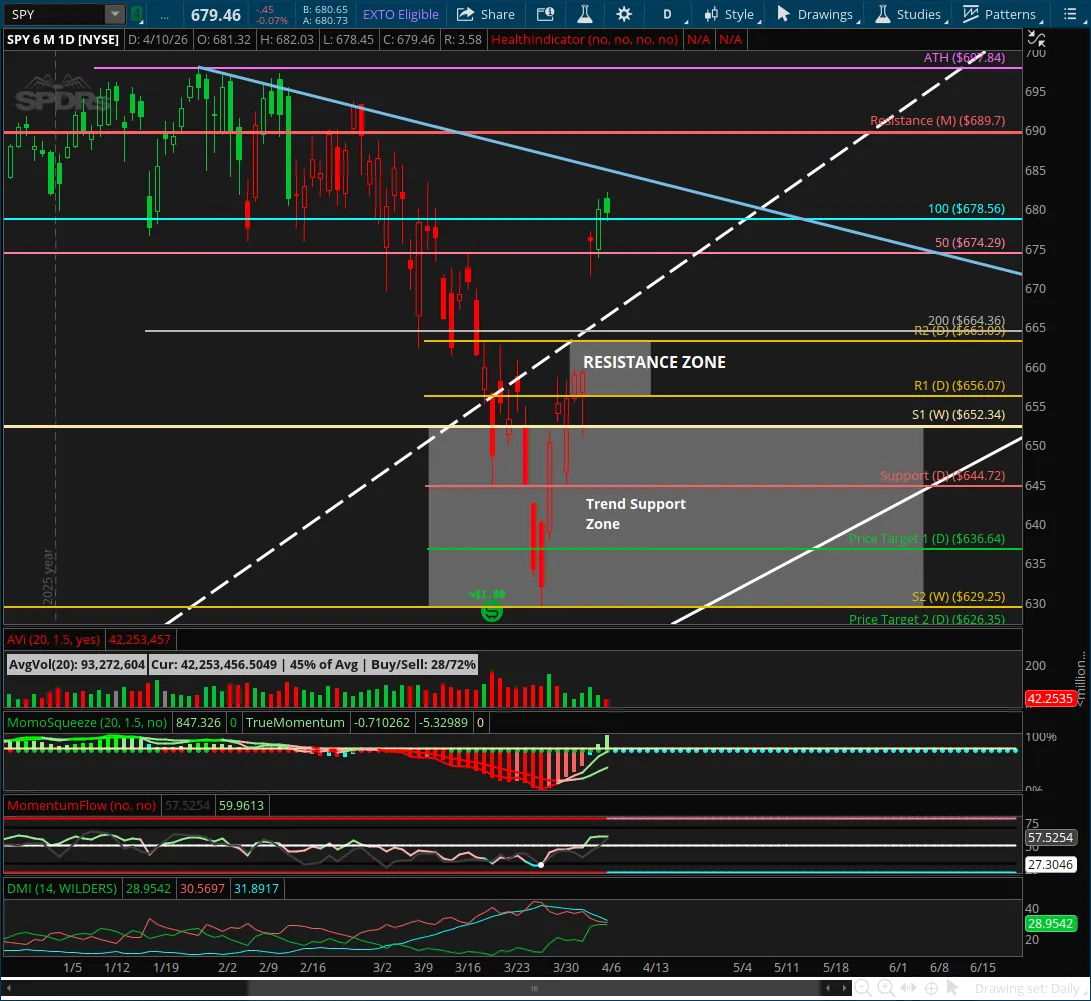
Key levels now in play:
Support / Structure
651.06 (4/7 low, bull flag watch start)
200SMA
50SMA
100SMA
Overhead Resistance
Daily downtrend line
682.03 (recent high)
689.7 (monthly resistance)
The next structural step is for price to either:
Continue making higher highs and higher lows, extending the recovery
Or pull back and form the first lower high and lower low needed to establish the bull flag
⸻
🔍 Momentum Context
Momentum has improved, but it has not fully flipped bullish yet.
• MACD remains below zero
• DMI has not crossed bullish yet
• DI+ is rising
• DI- is falling
• Price has reclaimed the 50SMA and 100SMA
This is an improving momentum picture, but still one that suggests trend repair rather than confirmed bullish expansion.
Negative MACD values often keep price pinned to a more sideways / choppy path while the trend shifts.
So the recovery is real, but it is not yet clean.
⸻
⚠️ Important Structural Note
Two things are especially important going into this week.
1️⃣ The Daily Downtrend Is Still Intact
Even with last week’s strong rebound, price has not yet broken the daily downtrend line.
That means bearish pressure still exists overhead.
A breakout above the eventual bull flag resistance, once formed, would likely be what finally breaks that downtrend and shifts control more convincingly back toward the bulls.
2️⃣ The 200SMA Is a Key Decision Point
The 200SMA now becomes one of the most important levels on the chart.
If price can hold above it during the next pullback, that would strongly support the case for a real bull flag forming.
If price fails to hold the 200SMA, then the 50SMA risks getting dragged back down, which increases the odds of another deeper move lower and a retest of the lows.
⸻
🧭 What Happens Next
Going into this week, the key questions are:
1️⃣ Does Price Continue Making Higher Highs and Higher Lows?
If yes, then the recovery is still extending and the potential bull flag is getting larger before it forms.
2️⃣ Do We Get the Pullback Needed to Form the Pattern?
A pullback is still likely, both to:
Help fill part of the gap
Create the first lower high and lower low needed to establish the bull flag
One or both of those should happen soon.
3️⃣ Can the 200SMA Hold?
If price pulls back but holds the 200SMA, then the odds improve that the market is building a real recovery structure.
If it fails to hold, the market risks revisiting the lows again.
⸻
🎯 Bottom Line
Last week’s rebound did three important things:
Invalidated the prior bear flag
Reclaimed the 50SMA and 100SMA
Started the watch for a new bull flag beginning at 651.06 (4/7 low)
But the market is not yet in a confirmed bullish pattern.
We are still waiting for the structure to form.
That means this week is about watching:
whether price continues higher first
whether we get the pullback that forms the pattern
and whether the 200SMA can hold when tested
For now, the rebound is promising — but the pattern still needs to be built.
