SPY Stalls Beneath Trendline — Structure Tightens, Bulls Hold Control
📅 DAILY MARKET ANALYSIS (SPY — Daily Chart)
Week of January 19, 2025
Last week’s action added another layer to the narrative we’ve been building for weeks: the market continues to grind higher, but it’s doing so through a series of increasingly tight, increasingly shallow patterns — each one smaller than the last — as momentum gradually cools.
It’s a momentum burn phase, not a breakdown.
And while the tape remains bullish, it’s no longer clean.
We saw that dynamic play out across each session:
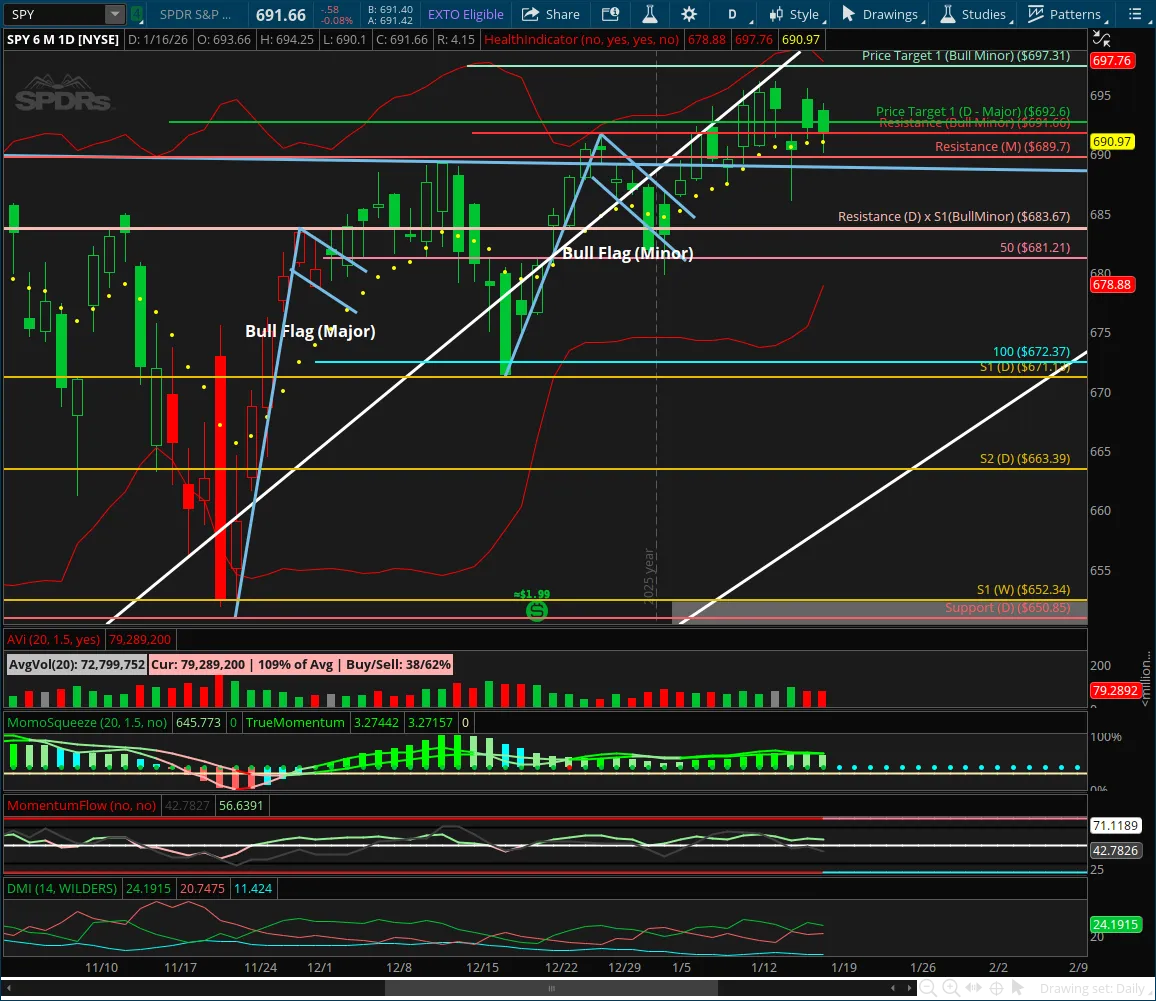
Monday–Tuesday: Price made higher highs and higher lows, attempting to follow through on the prior week’s strong close but the advance stalled directly at the rising weekly trendline, exactly where we expected resistance.
Wednesday:
Price opened lower and sold off early, but a strong intraday reversal produced a long bottoming wick — a classic momentum reset. While the close remained below the 10EMA, the candle signaled buyers stepping in with strength, setting up the potential for short-term follow-through.
Thursday:
That follow-through played out at the open. Price gapped higher, fueled by Wednesday’s bullish momentum — but the rally was sold throughout the session. Bulls took profit, and the close near lows confirmed that early strength wasn’t sustained.
Friday:
A slower, grindy session. After drifting through much of the day, price sold off into the afternoon — then recovered into the close. But unlike Wednesday, there was no bottoming tail. Price simply closed flat — right at minor resistance (691.66) — not above it. It was a technical hold, but not a show of strength.
These moves tell us the following:
🔄 Minor Pattern Stalled — 10EMA Now Deprioritized
Last week’s close below the 10EMA effectively stalled the minor bull flag. The structure is still technically intact, but momentum no longer justifies focusing on it for active trades.
And with the minor flag now deactivated, the 10EMA loses relevance as a dynamic trend guide.
While price has reclaimed it briefly in recent sessions, we’re no longer using it as a primary lens to evaluate strength or continuation potential.
This marks a clear shift in how we’re reading structure going forward:
The broader pattern — the major bull flag — is now the dominant map.
🔭 What We’re Watching Now
With compression building and momentum fading, price is currently coiling inside a tightening range — and Bollinger Bands are starting to curl inward, increasing the likelihood of a new squeeze developing.
Here’s what matters now:
683.67 (Major Bull Flag Resistance Turned Support): This level aligns with the 50SMA and would be a natural zone to watch if price pulls back from current levels. It also represents the top of the major pattern’s support zone.
50–100 SMA Zone (Major Pattern Support): This is now the key structural region. A move into this area — and a successful hold — would preserve the pattern’s higher-low integrity and create space for a proper trend reset. That’s where the next meaningful move could build from.
697.31 (Minor Pattern Target 1): A breakout above this level would invalidate the stall and likely trigger a strong continuation toward the major bull flag’s second target at 703.95.
⚖️ Inflection Scenarios Heading Into This Week
Here’s what we’re watching next:
✅
If Price Holds Current Levels or Breaks Above 697.31:
The uptrend continues
703.95 becomes the next objective
Watch for signs of exhaustion near target zones — this move has been building for months
⚠️
If Price Fails and Breaks Below Last Week’s Low:
It likely signals a short-term exhaustion and breakdown from this tight range
The market could retrace quickly toward 683.67 or the broader 50–100 SMA zone
As long as the major bull flag holds support, structure remains intact — and the pullback becomes a buying opportunity, not a breakdown
🎯 Bottom Line
Price remains in a high-and-tight consolidation range near recent highs
Momentum is fading, not failing — but breakout strength is lacking
We’ve shifted focus off the minor flag and 10EMA and back onto the major bull flag and broader structure
A breakout above 697.31 could trigger the next leg higher
A breakdown below last week’s low likely leads to a deeper reset toward major support
Until either one of those happens — stay nimble, follow leaders, and let structure confirm.
When in doubt, don’t force swing entries on SPY.
Let the tape guide the setups.
