
Alternative: SPY Trend Still Bullish, but Resistance Is Starting to Matter
📆 DAILY CHART OUTLOOK — SPY
Week of May 25, 2026
The daily chart is still bullish overall, but the clean continuation phase is no longer as straightforward as it was a couple of weeks ago.
Last week we noted that momentum was starting to shift more toward the intraday side after price had already reached the second weekly target and begun to cool.
That is exactly what played out.
The trend has not failed, but after the first loss of the 10EMA (D) during this run, the broad easy continuation phase is no longer the cleanest place to force new swing exposure on the index itself.
⸻
📌 Pattern State
Pattern State: Bull Flag Active
Pattern Start: 651.06 (4/7 low)
High Anchor: 715.63 (4/28 high)
Trigger: Thursday, 5/1 breakout above 715.63 confirmed continuation from the active bull flag
⸻
🔄 Structural Sequence (What Happened)
1️⃣ Monday — 10EMA Test Holds
Monday price tested the 10EMA (D) and found buyers near the lows.
That support held and price pushed higher into the close, keeping continuation technically intact.
⸻
2️⃣ Tuesday — 10EMA Lost
Tuesday the 10EMA (D) was lost.
That took the clean continuation setup out of play and shifted the opportunity away from broad swing continuation and more toward intraday execution.
The trend itself did not fail, but the easy part of the move was clearly no longer in the same state.
⸻
3️⃣ Wednesday — 10EMA Reclaimed
Wednesday price reclaimed the 10EMA (D), putting the market back in position for another test of the weekly target zone, now acting as resistance.
That kept the bullish structure alive and showed buyers were still willing to defend the trend.
⸻
4️⃣ Thursday — Push Higher Continues
Thursday price continued higher.
That kept the broader bullish trend intact and put the market back within reach of the key resistance area overhead.
⸻
5️⃣ Friday — Resistance Test, Rejection Near Highs
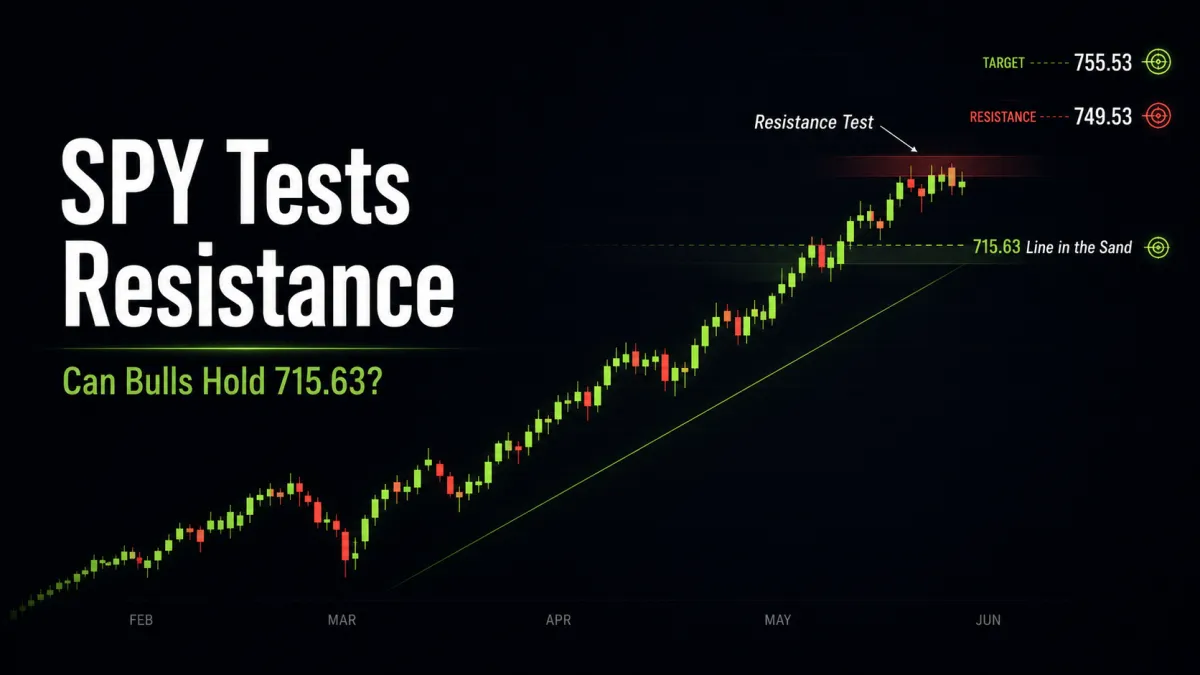
Friday pushed back into the prior weekly target / resistance zone and rejected near the highs.
That does not mean the move is over.
But it does confirm that price is now operating in a more contested area where continuation is no longer effortless and resistance matters more.
⸻
📐 Immediate Structure Map
The same daily bull flag remains in play, but the market is now much more dependent on how it behaves around resistance and key near-term support.
Key levels now in play:
Upside / Continuation
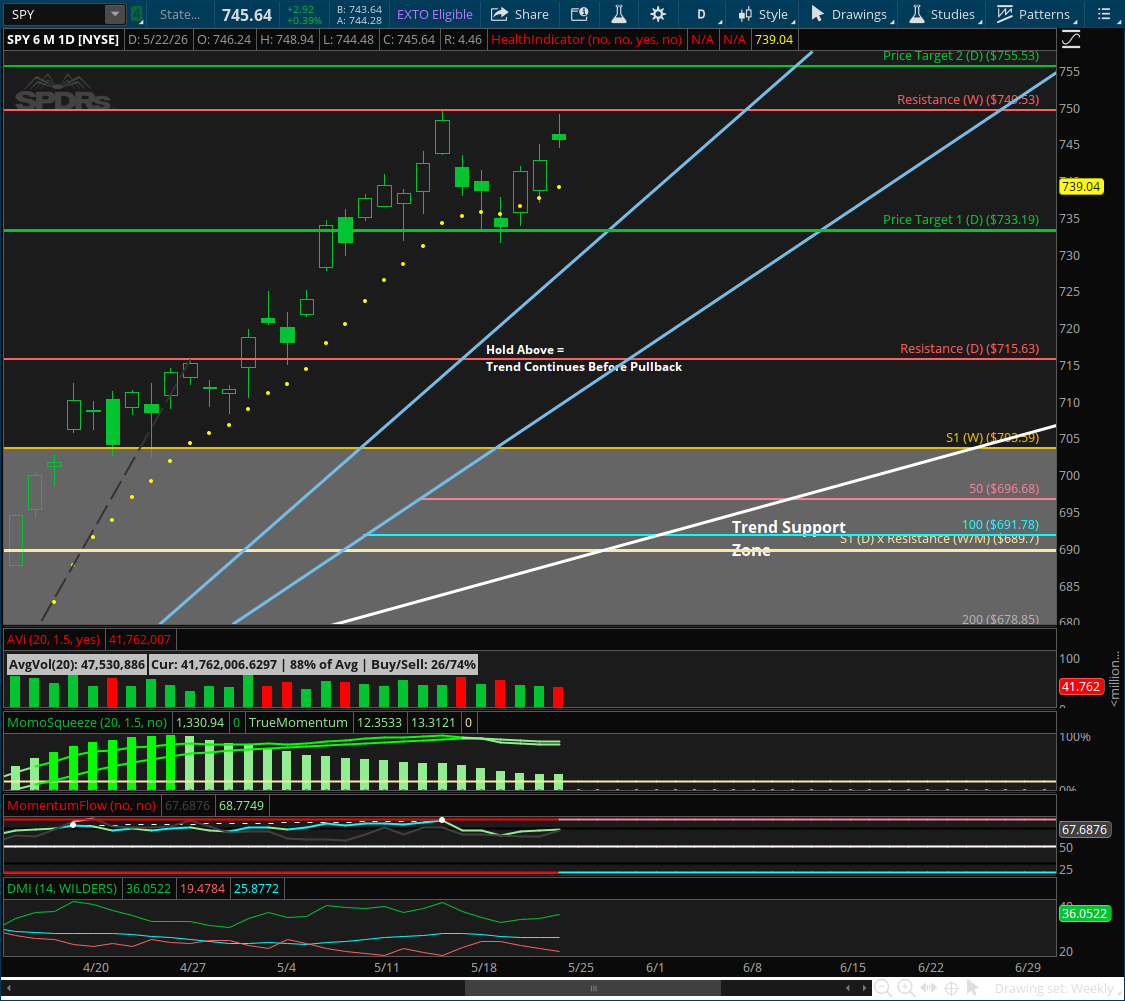
748.94 (Friday high)
749.53 (new weekly resistance)
755.53 (second daily target)
Support / Retest
715.63 (line in the sand / breakout level)
10EMA (D)
broader daily / weekly flag support beneath if 715.63 fails
As long as price remains above 715.63, the broader bullish structure remains intact.
⸻
🔍 Momentum Context
Momentum is still bullish overall.
• DMI remains bullish
• MACD remains bullish
• Daily SMA structure has returned to its healthiest position in months
• The market is still geared toward making new 52-week highs as long as support holds
But the important nuance is this:
The move has already played out to major targets.
That means broad trend continuation is no longer the only story. From here, how price reacts to support and resistance matters more than raw momentum alone.
⸻
⚠️ Important Structural Note
The key line in the sand now is:
715.63
If price can hold above that level, then the most likely outcome is a period of consolidation, likely a couple of weeks, before a new daily pattern forms and the trend resumes toward the new weekly pattern’s targets.
If price fails to hold 715.63, then a deeper retracement into the daily and weekly flag support zones likely comes into play, and probably rather quickly.
So the trend is still bullish, but the market is now at the stage where support quality matters more than momentum excitement.
⸻
🧭 What Happens Next
Going into this week, the key questions are:
1️⃣ Does Price Break Friday’s High?
If price breaks above 748.94 and especially above the newly formed weekly resistance at 749.53, then bulls are likely to make the final push toward:
755.53
That would likely create strong intraday opportunity with ORBI in the process.
2️⃣ Does Price Break Below Friday’s Low?
If price breaks below Friday’s low on Monday, the market is likely to pull back to retest the breakout above 715.63 before finding support.
That would be a normal and healthy test unless that level fails.
3️⃣ Does the Trend Consolidate or Retrace More Deeply?
As long as 715.63 holds, a period of consolidation is the more likely path.
If it fails, the next support levels from the daily and weekly bull flags come into play quickly.
⸻
🎯 Bottom Line
The daily trend is still bullish, but the broad easy continuation phase has likely already done most of its work.
The same daily bull flag remains active, and continuation is still technically alive, but after the 10EMA breach on Tuesday, the higher-probability opportunity on the index itself has shifted more toward intraday execution than fresh broad swing chasing.
So for now:
Bulls still control the bigger trend
715.63 is the key line in the sand
A break above 748.94 / 749.53 likely sends price toward 755.53
A break below Friday’s low likely starts the retest
Focus should stay on leaders, not laggards
This is the kind of tape where strong names can still lead, but chasing weak ones just because they “haven’t moved yet” is how people donate money to the market.
