
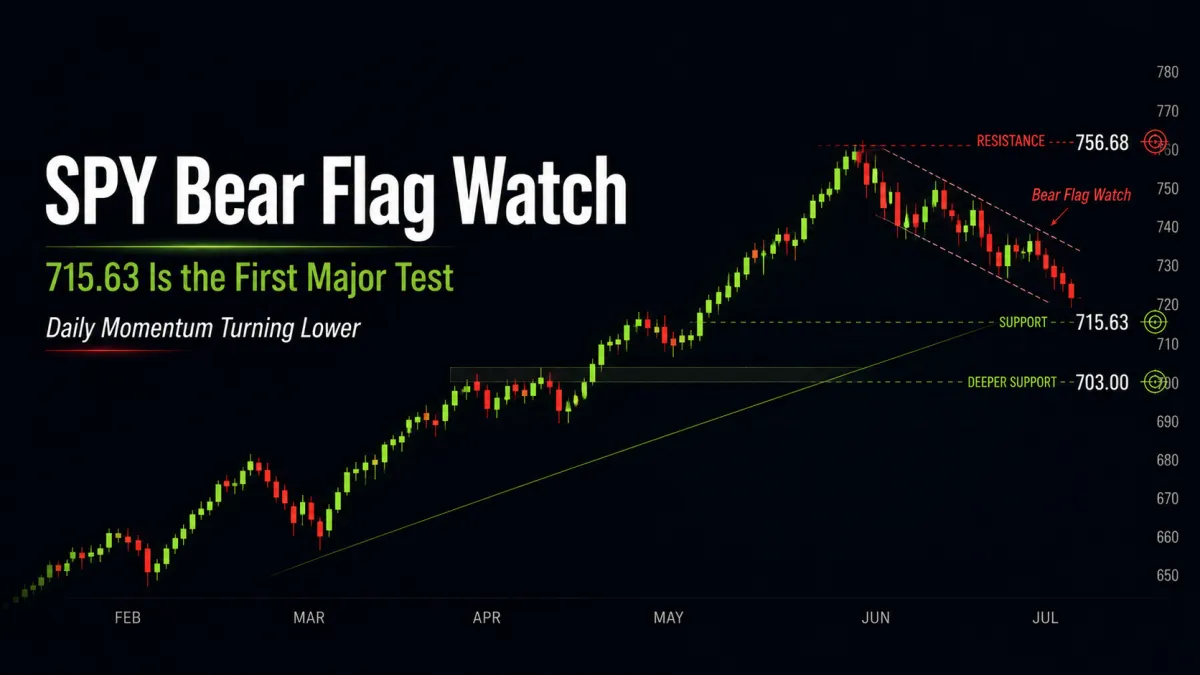
SPY Bear Flag Watch Active as Market Drifts Toward Key Support
📆 DAILY CHART OUTLOOK — SPY
Week of June 29, 2026
The daily chart has now clearly shifted lower.
Last week, the market lost the 10EMA again, broke below the active bull flag support band, and in doing so invalidated that bullish structure. That did not automatically create an active bearish pattern, but it did put the market back into a new bear flag watch as price continues trending lower.
That is the key point now:
There is no active completed pattern yet, but the market is clearly in a bearish formation phase.
⸻
📌 Pattern State
Pattern State: Bear Flag Watch
Pattern Start: 756.68 (6/15 high)
Anchor Low: Not yet established
Trigger: Bear flag formation remains underway as long as price continues printing lower highs and lower lows, and only ends once a higher high and higher low print
⸻
🔄 Structural Sequence (What Happened)
1️⃣ Monday — 10EMA Lost Again
Monday the market lost the 10EMA (D) again.
That was the first sign that the prior bounce was losing traction and that the market was not ready to resume higher from the recently formed bull flag.
⸻
2️⃣ Tuesday — Bull Flag Invalidated
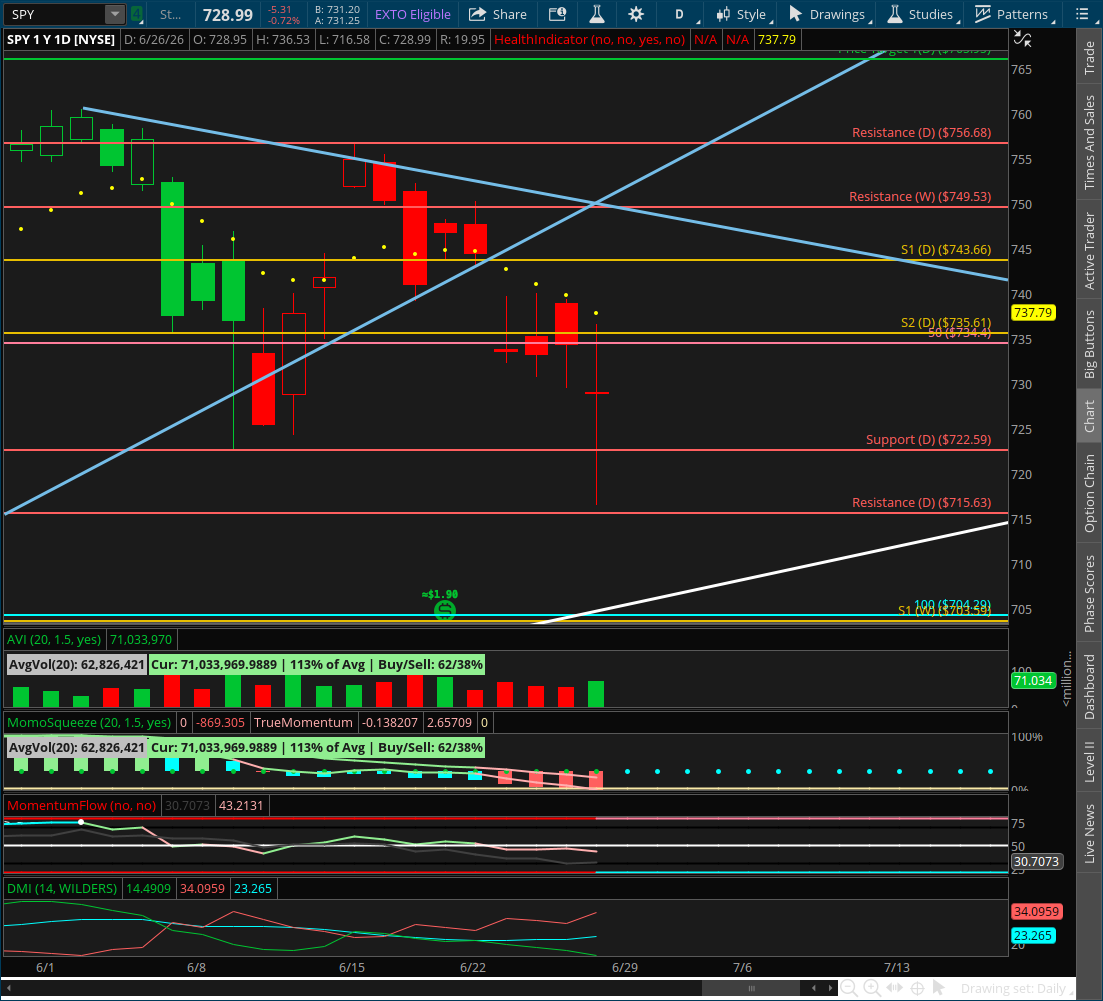
Tuesday gapped down and closed below the bull flag defense band, breaking the key 735.61 level in the process.
That invalidated the recently formed daily bull flag and started paving the way lower.
Once that level broke, downside chop became the more likely path, especially with the broader market still bullish on higher timeframes while the daily was trying to cool off after the strong March-to-May run.
⸻
3️⃣ Wednesday — Outside Bar Below Lost Support
Wednesday printed an outside bar while continuing to hold below the broken support band.
That confirmed the market was no longer trying to reclaim the failed bull structure. Instead, price was starting to stabilize underneath it.
⸻
4️⃣ Thursday — Lower High and Lower Low
Thursday continued the new bearish sequence with a lower high and lower low.
That kept the new bear flag watch active and reinforced that the short-term trend had shifted lower.
⸻
5️⃣ Friday — Lower High and Lower Low, Retest Near 715.63
Friday printed another lower high and lower low and sold off sharply, reaching almost all the way down to the 715.63 resistance / retest level we had been highlighting for weeks as a likely downside test zone.
That move did not complete a full active bear flag yet, but it did keep the bearish formation process intact.
⸻
📐 Immediate Structure Map
The prior bull flag is gone, and the most useful near-term map is now the new bearish formation path.
Key levels now in play:
Near-Term Resistance
756.68 (bear flag watch anchor high)
broken bull-flag support band above
recent lower-high area
Near-Term Support / Retest
715.63 (major daily breakout retest)
below that: 703 zone / 100SMA (D) / weekly support
As long as price continues printing lower highs and lower lows, the new bear flag watch remains active.
⸻
🔍 Momentum Context
The daily momentum picture now leans bearish.
• DMI is in a very bearish position
• MACD is bearish, though the average value is still well above the zero line
• RSI is below 50, showing bearish momentum
• Oversold conditions on this timeframe would likely be needed before a bigger bounce develops from support
That is the nuance here:
The daily is weak enough to suggest lower prices are still likely, but not yet fully washed out in a way that usually produces the best rebound conditions.
⸻
⚠️ Important Structural Note
The daily now answers the “how” while the weekly answers the “to where.”
The weekly suggests the market is likely headed toward a test of the broader support area, and the daily is now showing the formation process that could carry price there.
Most likely downside area from here:
715.63
then potentially the 703 zone
around the 100SMA (D) and weekly support
That does not mean price must go there in one straight line.
The key question now is whether price:
continues printing lower highs and lower lows until the new bear flag fully forms and resolves lower, or
prints a higher high and higher low first, which would end the current bearish sequence and change the near-term picture
Until one of those happens, the market remains in a bearish formation phase.
⸻
🧭 What Happens Next
Going into this week, the key questions are:
1️⃣ Does Price Continue Making Lower Highs and Lower Lows?
If yes, then the new bear flag keeps forming and the odds increase that price continues toward the 715.63 retest and possibly the broader 703 zone after that.
2️⃣ Does Price Stabilize and Print a Higher High / Higher Low?
If that happens first, then the bearish formation ends before becoming a more complete continuation structure.
That would shift the near-term picture away from clean downside continuation.
3️⃣ How Does Price React at Support?
If price gets into the 715.63 area and buyers step in aggressively, that could set up the next meaningful bounce.
If that area fails, then the 100SMA / weekly support zone near 703 becomes the next major area on watch.
⸻
🎯 Bottom Line
The daily has shifted back into a bearish formation phase.
the prior bull flag failed
735.61 broke
the 10EMA was lost
price is now trending lower from the 6/15 high at 756.68
There is still no active completed bearish pattern, but the bear flag watch remains active as long as price keeps printing lower highs and lower lows.
So for now:
daily momentum favors lower prices
715.63 is the first major retest level
703 / 100SMA / weekly support likely comes into play if that fails
and until a new clear structure resolves, the cleaner opportunities are still likely to be intraday / ORBI-focused, especially in the names showing the clearest leadership up or down
