
SPY Bears Take Control as Major Bull Flag Faces Breakdown
📆 DAILY CHART OUTLOOK — SPY
Week of November 2, 2026
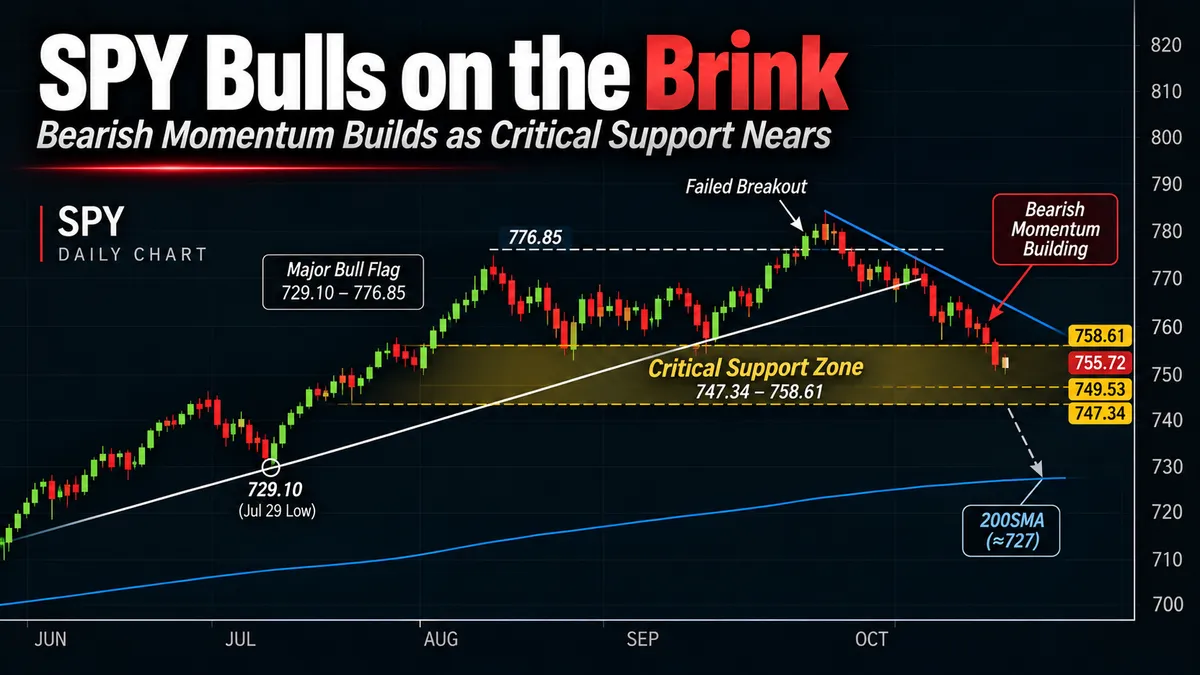
The daily chart is becoming increasingly bearish, and the major bull flag we've been following since August is now approaching what could be its final test.
For months, this pattern has remained our primary roadmap, even as shorter-term bullish and bearish structures developed and failed inside the larger consolidation.
That remains the case today.
The major bull flag is still technically active because SPY has not closed below its critical support at 747.34.
But I'm becoming increasingly convinced that this pattern is nearing its end.
We've now seen the weekly uptrend break, sellers take directional control on the daily chart, and downside momentum begin strengthening.
Friday's selloff only reinforced those concerns.
SPY traded down to 750.36, coming within approximately three dollars of the major daily bull flag's structural invalidation level before recovering modestly to close at 755.72.
And while the bulls technically defended the pattern, the larger momentum picture is becoming difficult to ignore.
I believe we're approaching the transition from a prolonged bullish consolidation into a more meaningful bearish correction.
That doesn't mean the new bearish pattern has already formed.
It hasn't.
But we're getting close to the levels and conditions that could establish it.
And how SPY reacts to Friday's selloff, particularly during any recovery attempt this week, may give us some of the clearest trading opportunities we've seen in several weeks.
📌 Pattern State
Pattern State: Bull Flag Active
Pattern Start: 729.10 (7/29 low)
Low Anchor: 729.10 (7/29 low)
High Anchor: 776.85 (8/5 high)
Active Bull Flag Levels
0% Support: 729.10
38.2% Flag Support: 747.34
61.8% Flag Support: 758.61
100% Resistance: 776.85
127.2% Target 1: 789.84
161.8% Target 2: 806.36
Pattern Confirmation: Bull flag established on 8/6.
Current Mode: Bearish retracement within the active major daily bull flag. Price has lost its rising trendline, sellers have taken directional control, and the market is testing the lower portion of the established bullish defense zone.
Bullish Defense Zone: 747.34–758.61
Immediate Downside Trigger: A break below Friday's low at 750.36, with a daily close beneath that level providing stronger evidence of continued bearish expansion.
Critical Weekly Support: 749.53
Structural Invalidation: A daily close below 747.34 invalidates the active major daily bull flag.
Developing Pattern Watch: A new daily bear flag may develop if the bullish structure fails and price establishes the necessary bearish continuation structure. That pattern is not yet confirmed and has no established targets.
📉 The Major Bull Flag Is Running Out of Room
The major daily bull flag has guided our analysis since August.
And despite months of consolidation, failed short-term patterns, and deteriorating momentum, the market has continued respecting its most important support.
That is still technically true.
But look at where we finished October.
SPY closed at 755.72, inside the major pattern's bullish defense zone and just above the critical support cluster we've been discussing:
758.61 — Major Daily Flag Support
749.53 — Weekly Breakout Support
747.34 — Major Daily Structural Invalidation
Those levels have become increasingly important as the market's momentum picture has deteriorated.
We've already lost the rising weekly 50% Fibonacci fan.
The bulls have failed to reclaim the weekly uptrend.
And now the daily chart is developing the kind of bearish momentum that could finally carry price through the support that's held for nearly three months.
The market hasn't invalidated the major bull flag yet, but it is showing increasingly convincing evidence that it may be preparing to do so.
That's why I'm becoming more defensive and shifting my attention toward opportunities that could develop from the next bearish move.
🔄 Friday's Selloff Changes the Immediate Roadmap
Friday's candle deserves particular attention.
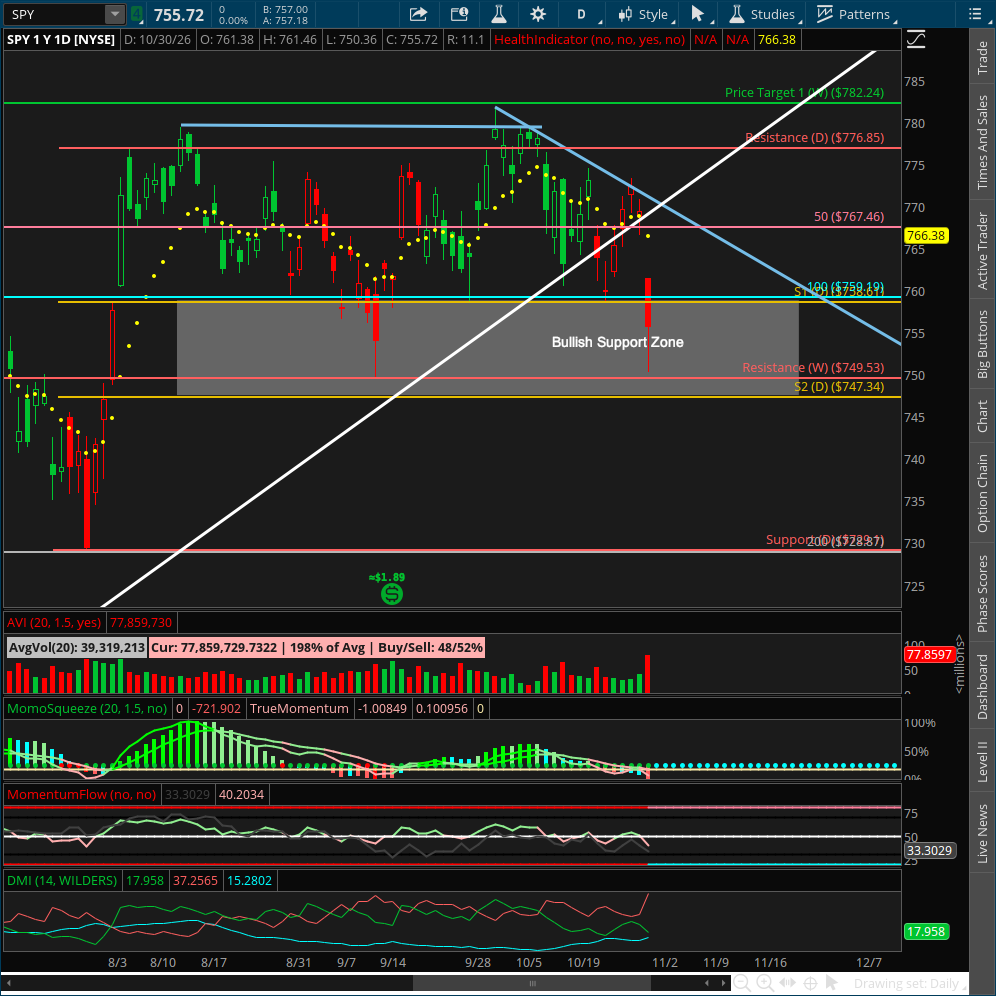
The session opened around 761.38, reached a high of 761.46, and then sold off sharply to 750.36 before recovering to close at 755.72.
That is a substantial intraday decline.
Volume was also elevated, reaching approximately 77.9 million shares, nearly twice the 20-day average.
The sharp selling was followed by enough buying to pull price away from the session low.
That's important because it tells us buyers haven't disappeared.
They're still willing to defend lower prices.
But the question is whether they're stepping in to rebuild the uptrend or simply reacting to an aggressive short-term selloff.
Those are two very different things.
And I suspect we may see another recovery attempt before the next meaningful leg lower.
A rally following Friday's selloff would not automatically change my bearish outlook.
In fact, depending on where that rally stalls, it could create one of the more attractive short opportunities of the coming week.
📐 Immediate Structure Map
There are several levels and technical references I'm watching closely.
1️⃣ Friday's Gap and the Daily 50SMA
The first area I'm interested in is overhead.
Friday's selling created a price imbalance that the market may attempt to fill during a recovery.
The daily 50SMA and the newly established descending trendline are also important resistance references.
If SPY begins rallying early this week, these are the areas where I'll be watching closely for sellers to return.
A recovery into the gap, followed by rejection near the 50SMA or descending trendline, would fit the bearish continuation scenario I'm anticipating.
It could also create an attractive location for initiating defined-risk bearish exposure.
But I don't want to short simply because price reaches resistance.
I want to see the recovery begin failing, sellers regain control, and momentum confirm the reversal.
There's a meaningful difference between anticipating resistance and watching price actually reject it.
And given how volatile the market has become, that confirmation matters.
2️⃣ 750.36 — Friday's Low
This is the most important immediate downside reference.
Friday's low was:
750.36
A move beneath that level would tell us sellers have overcome the buyers who stepped in during Friday's decline.
A daily close below it would provide stronger confirmation that the bearish move is continuing.
And because 749.53 sits immediately beneath that low, a breakdown would almost immediately bring the August weekly breakout into focus.
That could be the beginning of the next meaningful downside expansion.
However, breaking 750.36 is not the same as invalidating the major daily bull flag.
That requires a daily close below 747.34.
We need to keep those conditions separate.
3️⃣ 749.53 — Weekly Breakout Support
This is the first major higher-timeframe support level beneath Friday's low.
We've been watching 749.53 since the market broke above it during the first week of August.
For nearly three months, that level has represented the foundation of the weekly bullish breakout.
Now the market is approaching it with sellers controlling daily directional momentum.
A breakdown through 749.53 would be an important sign that the bullish structure is losing another layer of support.
But the ultimate daily pattern decision sits just beneath it.
4️⃣ 747.34 — Major Bull Flag Invalidation
This is the critical level.
A daily close below 747.34 invalidates the major bull flag we've been following since August.
At that point, I would stop using the current bullish structure as our primary roadmap.
Instead, I'd begin watching for a new bearish pattern to establish itself.
Given the momentum conditions we're seeing, I think that's becoming the increasingly likely outcome.
But we haven't gotten that confirmation yet.
So for now, the major bull flag remains our active pattern.
We follow the pattern that exists until the market establishes a reason to replace it.
⚠️ A New Bear Flag May Be Developing
This is where the next phase of the analysis becomes particularly interesting.
I believe we're approaching the conditions necessary for a new daily bear flag to develop.
But I want to be very clear about something:
The new bear flag has not been confirmed.
The major daily bull flag remains active.
And simply having bearish momentum, a sharp decline, or a break of a trendline does not automatically establish a new bear flag.
We need the proper price structure.
What I'm Watching for the New Pattern
If SPY breaks the major daily bull flag's support, I'll begin watching how the next bearish structure develops.
The first phase may be the sharp move lower we're already experiencing.
From there, I want to see the market begin establishing a countertrend recovery characterized by a sequence of higher highs and higher lows.
That recovery would help define the consolidation portion of the developing bear flag.
Inside bars and outside bars do not, by themselves, terminate the developing trend sequence. They can extend the structure while we wait for the necessary price action to establish the pattern.
Once the new bear flag is properly defined, we'll have the structural anchors needed to calculate its Fibonacci targets and establish a much clearer roadmap for the next bearish continuation.
Until then, assigning precise downside targets to a pattern that hasn't formed would be premature.
The bearish outlook is developing. The new bearish pattern is not yet confirmed.
Those are two different things.
🔍 Friday's Selloff May Only Be Setting the Stage
There's another possibility worth discussing.
The recent selling may not ultimately become part of the new bear flag's defining structure.
It may simply be the initial shock that creates the conditions for a larger bearish pattern to form over the next several weeks.
That's why I'm not assuming we need an immediate, uninterrupted decline from Friday's close.
I wouldn't be surprised to see a rally develop early this week.
In fact, after the sudden selling and sharp fluctuations in volatility, a recovery attempt would make sense.
But that recovery could create a false sense of confidence.
Buyers who have grown accustomed to purchasing every dip may view the rebound as confirmation that the correction has ended.
Meanwhile, the larger technical structure may still be deteriorating.
That creates the possibility of a familiar sequence:
Sharp decline → relief rally → buyers regain confidence → rally stalls at resistance → sellers return → next leg lower
And if that sequence develops, the relief rally could eventually help establish the new bear flag.
Alternatively, the market may need several weeks of volatile back-and-forth movement before the next structure becomes sufficiently clear.
I'm interested in the bearish opportunity, but I'm not interested in forcing the timing.
Let the market show us where the next resistance forms and whether sellers are prepared to defend it.
🔍 Daily Momentum — Bears Have Taken Control
The daily momentum picture is one of the strongest arguments for expecting additional weakness.
We've spent months watching trend strength deteriorate as SPY struggled to extend its advance.
Now the directional balance has shifted.
And unlike the weekly chart, where ADX is still declining, daily ADX is already moving higher.
That's important.
It suggests sellers may be beginning to develop a more established directional trend on the daily timeframe before the larger weekly indicators fully confirm the change.
ADX — Bearish Trend Strength Is Building
Daily ADX has continued rising.
Current ADX: Approximately 15.28
The reading remains relatively low, but it's considerably higher than the sub-10 readings we were seeing earlier in October.
And the direction is now unmistakable.
Trend strength is increasing.
The concern is that it's increasing while sellers have directional control.
If that continues, I expect downside momentum to become increasingly difficult for bulls to resist.
The market doesn't need ADX to become particularly elevated before meaningful declines develop.
What matters is whether the indicator continues strengthening as sellers push through support.
That's what I'm watching.
DMI — Sellers Are Firmly in Control
The DMI readings are now decisively bearish.
DI-: Approximately 37.26
DI+: Approximately 17.96
That is a substantial separation.
The bears are no longer simply challenging the bulls for control.
They've taken it on the daily timeframe.
And with ADX continuing to rise, that directional advantage is becoming more meaningful.
A continued expansion in DI- alongside rising ADX would increase my confidence that a breakdown below 747.34 could lead to a sustained bearish move.
For bulls to regain control, I'd want to see that directional separation narrow materially and price begin rebuilding a healthier bullish structure.
As of Friday's close, we haven't seen that.
MACD — Momentum Remains Bearish
The recent deterioration in MACD remains part of the bearish picture.
We entered this correction watching MACD weaken and move toward the zero line.
That shift was one of the early warnings that the bullish momentum supporting the previous advance was disappearing.
Now price has continued lower while sellers have taken directional control.
What I'm watching for is whether momentum begins recovering during any relief rally or whether a bounce simply interrupts the decline before bearish pressure resumes.
If MACD remains weak while price rallies into resistance, that would reinforce my interest in a potential short setup.
A meaningful bullish recovery in momentum would make me more cautious about entering prematurely.
TTM Squeeze — Negative Momentum Is Developing
The daily TTM Squeeze histogram has now moved into negative territory.
That's another important development.
We've been watching positive momentum fade for weeks.
Now we're beginning to see the bearish side of that transition.
The question is how much negative momentum develops from here.
If the histogram begins producing progressively deeper negative readings, that would strengthen the case for continued selling.
Particularly if those readings exceed the negative momentum established during the previous bearish cycle.
That would indicate sellers are generating stronger downside momentum than they did during the prior decline.
But if price tests support while the histogram begins producing shallower negative readings, that could suggest selling pressure is starting to exhaust itself.
That comparison will be especially useful as the market approaches the potential formation of a new bear flag.
The histogram can help us determine whether sellers are accelerating or whether a relief rally is becoming more likely.
🎯 Where Could the Next Bearish Move Lead?
This is where the daily 200SMA becomes important.
The 200SMA is currently positioned just below the low SPY established at the end of July.
That puts it in the approximate 727–729 area, although the moving average will continue changing as new sessions develop.
I consider that a likely area for buyers to become considerably more interested if the market confirms a deeper correction.
And there are several reasons why.
First, it's a major longer-term moving average.
Second, it sits near the 729.10 low that established the beginning of our current major bull flag.
Third, a correction toward that region would represent a meaningful reset of the advance that's taken place since April.
If the current bull flag fails and the market establishes a new bearish pattern, I believe the 200SMA area is a credible destination for the larger move.
That doesn't mean price has to move directly there.
Nor does it mean the future bear flag's exact Fibonacci targets will necessarily align with the moving average.
We won't know that until the new pattern forms and establishes its anchors.
But the 200SMA provides an important structural reference for where I expect buyers may eventually return in greater strength.
🧭 What Happens Next
1️⃣ Does SPY Rally Into Friday's Gap?
This is one of the first things I'll be watching.
After Friday's aggressive selloff, a relief rally would not surprise me.
That move could draw buyers back into the market, particularly after several weeks of declining prices.
But I'll be watching the gap area, daily 50SMA, and descending trendline for signs of rejection.
A rally into resistance followed by renewed selling could create an attractive bearish entry opportunity.
I want to see confirmation rather than assume the rejection will occur.
2️⃣ Does Price Close Below 750.36?
Friday's low is the immediate downside trigger.
A break beneath 750.36 would indicate that the buyers who defended Friday's selloff are losing control.
A daily close beneath that level would strengthen the case that another bearish expansion is underway.
And it would bring 749.53 and 747.34 directly into focus.
3️⃣ Does the Major Bull Flag Finally Break?
This is the most important structural question.
The major daily bull flag remains active until we receive a daily close below 747.34.
If that happens, the pattern we've followed since August is invalidated.
And the bearish structure developing around the current decline becomes our next focus.
But even then, I don't want to declare a fully formed bear flag before the market establishes the necessary sequence.
The invalidation of the bull flag and confirmation of the next bearish pattern are separate events.
4️⃣ Does a Higher-High / Higher-Low Sequence Develop?
This will become particularly important after the initial bearish move.
I'm watching for a countertrend rally that begins creating the structural sequence needed to establish the next bear flag.
Inside and outside bars can extend the sequence without ending it.
Once that new pattern is established, we'll be able to identify its structural anchors, resistance, and projected downside targets.
That will give us a considerably cleaner roadmap for managing bearish positions and taking profits.
Until then, we're working with the established support, resistance, and momentum conditions rather than pretending a future pattern is already confirmed.
5️⃣ Does the Daily 200SMA Become the Next Major Destination?
If the current bull flag fails and sellers continue developing momentum, I expect the market to begin working toward the daily 200SMA.
That's where I'll become increasingly interested in watching for buyers to establish a meaningful longer-term defense.
But I don't want to assume the moving average will automatically stop the decline.
Just as we're waiting for bearish confirmation around current resistance, I'll eventually want bullish confirmation around that lower support.
The process works in both directions.
🎯 Trading Strategy — Preparing for the Next Bearish Move
This is an environment where I believe some of the better swing opportunities may begin developing over the next week or two.
But I don't expect them to be particularly smooth.
When a market has enjoyed a strong bullish advance followed by months of consolidation, the eventual unwinding can become much more violent than the advance itself.
Buyers who have grown accustomed to purchasing every pullback don't immediately abandon that behavior.
They continue stepping into weakness.
Some of those attempts produce sharp rallies.
Others fail quickly as sellers regain control.
That can create substantial volatility, even when the larger directional bias is bearish.
I expect more whipsaw price action, not a clean straight-line decline.
And that's why I'm approaching the next potential short opportunity carefully.
Defined-Risk Bearish Spreads
With volatility moving sharply in both directions, I'm particularly interested in using defined-risk bearish option spreads to express the developing downside thesis.
Properly structured, these positions allow us to define the maximum loss at entry rather than taking open-ended exposure.
They also limit potential profit, so the structure still needs to fit the expected move and timing.
My preference would be to consider building exposure gradually over the next week or two as the market establishes its next structure.
Not by blindly adding to a losing position.
But by using confirmed resistance rejections and developing bearish momentum to determine when additional exposure is justified.
The ideal opportunity may come from a recovery into Friday's gap, the 50SMA, or the newly established daily downtrend line.
If price rejects those areas and lower timeframes begin aligning bearishly, that could provide the confirmation I'm looking for.
Once a proper daily bear flag forms, we'll have more precise targets to help determine where profits should be taken.
Until then, patience matters.
📊 Watch the Market Leaders
Another important part of this week's approach is monitoring the stocks that have been leading the market.
Strong technology names have enjoyed substantial bullish momentum throughout the year.
But if the broader market begins transitioning into a deeper correction, those same names could begin unwinding aggressively.
That's why I'm watching their technical structures very closely.
In particular, I want to know:
Are former market leaders beginning to establish bearish continuation patterns?
Are their daily and weekly momentum indicators deteriorating?
Are they losing important support levels?
Are they beginning to generate "Pulling Back" or "Breakdown" signals through SwingTraderPro?
Are multiple timeframes beginning to align in the bearish direction?
Those developments could help identify the stocks best positioned to participate in the next meaningful downside move.
And in a period of increasing volatility, the resulting swings may provide substantial opportunities.
But I want to emphasize something:
The strongest bearish opportunities won't necessarily be the stocks that have already fallen the most.
They'll be the names where weakening structure, resistance, and momentum align to support a trade with a clearly defined risk.
That's what I'm looking for.
⚡ Intraday Trading — Stay Nimble
Until the next larger pattern establishes itself, intraday trading remains particularly attractive.
We could see substantial reversals from one session to the next.
A strong rally Monday doesn't automatically mean the correction is finished.
A sharp decline Tuesday doesn't automatically mean a new bearish trend has fully developed.
That's why I'm continuing to focus on our bullish and bearish scanners alongside ORBI.
I want to identify the names where multiple timeframes are aligned with the direction of the move currently developing.
When buyers are in control, that means focusing on bullish setups.
When sellers take over, it means focusing on bearish setups.
And with the market approaching important support while volatility remains elevated, I'm particularly interested in taking advantage of shorter moves rather than assuming every breakout or breakdown will continue indefinitely.
There's no need to predict every turn.
Let the market reveal the direction.
Trade the setups with the strongest confirmation.
And take profits when the opportunity presents itself.
This is not the environment to become emotionally attached to a directional thesis simply because one session appears to support it.
⚠️ Don't Confuse a Relief Rally With a Reversal
This is probably the most important trading reminder heading into the new week.
I would not be surprised to see SPY recover some of Friday's losses.
That would be entirely normal after a sharp decline.
And it could even produce several convincing bullish sessions.
But the larger structure matters.
The monthly chart is beginning a cooling process after seven consecutive months of overbought RSI.
The weekly uptrend has broken, and sellers have taken directional control.
The daily chart is showing rising ADX with bearish DMI separation and a negative TTM Squeeze histogram.
Those conditions don't disappear simply because price rallies for a day or two.
A short-term recovery can occur inside a developing bearish environment.
And in fact, that recovery may be exactly what eventually establishes the new bear flag.
So if we see buyers step in early this week, I'm not going to assume that the correction has ended.
I'll be watching where price finds resistance and whether the recovery develops enough structural strength to genuinely challenge the bearish outlook.
Until that happens, I remain skeptical.
🎯 Bottom Line
The daily chart is approaching a major turning point.
The bull flag we've followed since August remains technically active, but sellers are increasingly threatening the support that has kept it intact.
Pattern State: Bull Flag Active
Pattern Start: 729.10 (7/29 low)
Low Anchor: 729.10 (7/29 low)
High Anchor: 776.85 (8/5 high)
Bullish Defense Zone: 747.34–758.61
Structural Invalidation: Daily close below 747.34
Major Bull Flag Target 1: 789.84
Major Bull Flag Target 2: 806.36
The immediate downside roadmap is:
750.36 — Friday's Low
749.53 — Weekly Breakout Support
747.34 — Major Daily Bull Flag Invalidation
If those levels fail, my attention shifts toward the formation of a new daily bear flag and eventually the daily 200SMA near 727–729.
But that new bearish pattern is not confirmed yet.
And we shouldn't treat it as though it is.
The first thing I'm watching this week is whether SPY attempts to rally into Friday's gap, the daily 50SMA, or the newly formed descending trendline.
A rejection from that area could create an attractive opportunity to position for the next leg lower.
The second thing I'm watching is whether price breaks and closes below 750.36.
And the third is whether 747.34 finally fails, invalidating the major bull flag and opening the door for a new bearish structure to develop.
I believe a correction is underway.
And given the monthly, weekly, and daily momentum picture, I expect the cooling process could last at least another month or two before buyers establish a sustainable recovery.
But I don't expect that process to be smooth.
After such a strong bullish advance, the unwinding of momentum can be violent as buyers continue trying to purchase dips before the selling has fully run its course.
That's why I'm remaining focused on defined-risk bearish swing opportunities, watching the market leaders for deteriorating structures, and continuing to use ORBI for shorter intraday trades in whichever direction momentum develops.
The bulls have lost control of the weekly trend.
The bears have taken control of the daily momentum.
And the major daily bull flag is running out of room.
A relief rally may come first.
A new bear flag may take several weeks to establish itself.
But until buyers begin demonstrating meaningful strength again, I believe the path of greater risk remains to the downside.
Stay calm. Let the trade come to you. Don't confuse short-term volatility with a change in the larger trend, and don't react or overreact to every move in either direction.
The market is beginning to reveal its next opportunity.
Our job is to recognize the structure, wait for confirmation, and be prepared when it arrives.
