
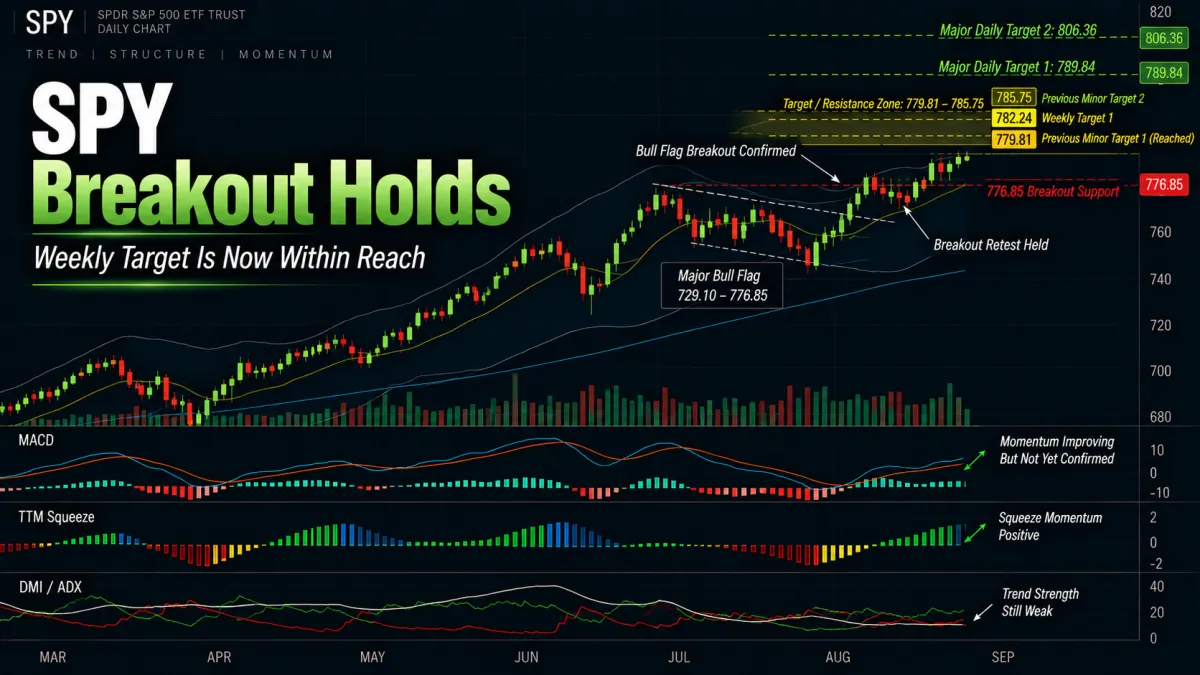
SPY Breakout Holds as Weekly Target Comes Into Reach
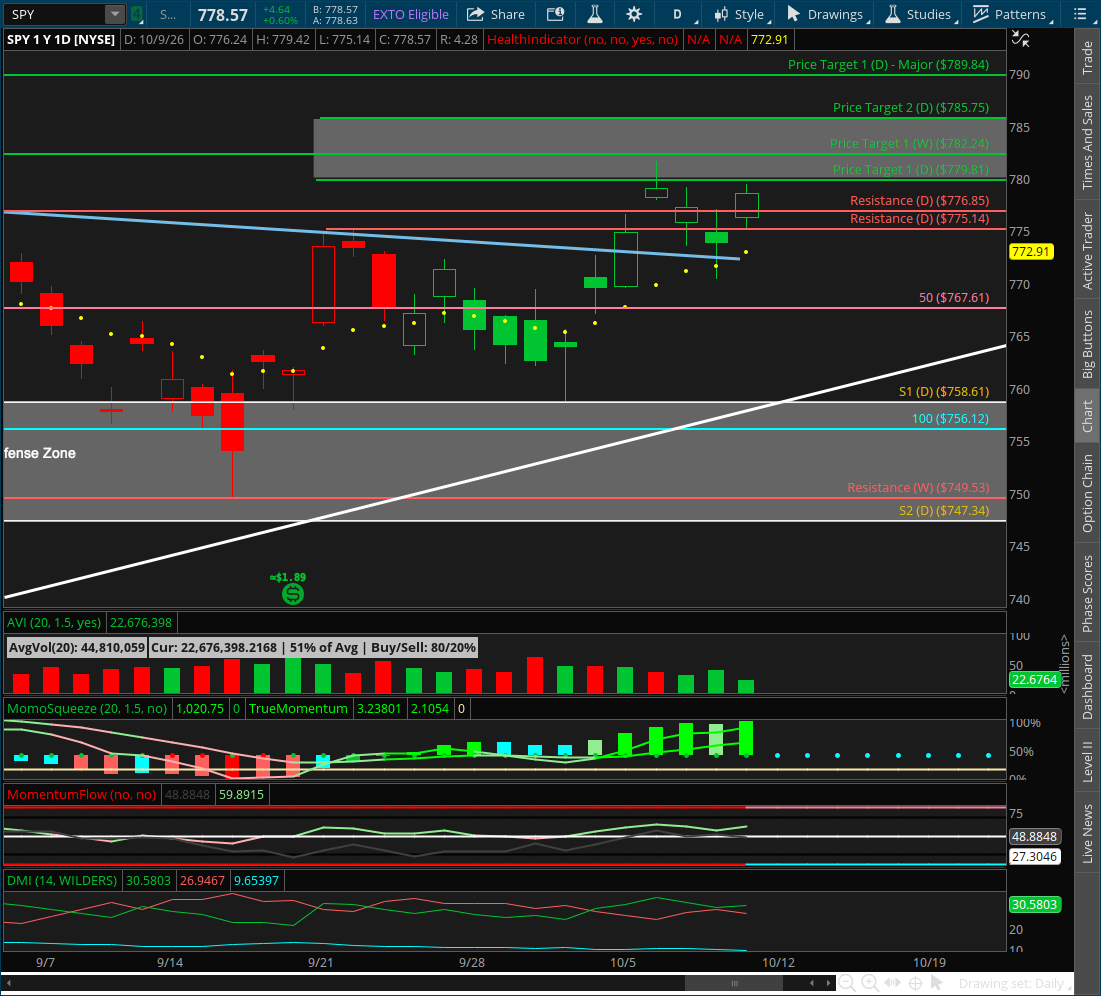
📆 DAILY CHART OUTLOOK — SPY
Week of October 12, 2026
Last week finally gave us the breakout we've been waiting for from the major daily bull flag.
SPY began the week by breaking above both the short-term downtrend and the known resistance structure overhead. Tuesday then gapped directly into the target / profit-taking zone we've been discussing, where sellers stepped in and locked in gains.
Instead of collapsing from there, price spent Wednesday and Thursday pulling back to retest the breakout, found buyers below the daily 10EMA, and then broke higher again Friday.
That is exactly the kind of behavior I wanted to see following a breakout.
The major bull flag remains in continuation, and as long as SPY continues holding above 776.85, the next targets remain firmly in play.
⸻
📌 Pattern State
Pattern State: Bull Flag Active — Continuation Confirmed
Pattern Start: 729.10 (7/29 low)
Low Anchor: 729.10 (7/29 low)
High Anchor: 776.85 (8/5 high)
Active Bull Flag Levels
0% Support: 729.10
38.2% Flag Support: 747.34
61.8% Flag Support: 758.61
100% Resistance / Breakout Level: 776.85
127.2% Target 1: 789.84
161.8% Target 2: 806.36
Pattern Confirmation: Bull flag established on 8/6.
Current Mode: Bullish continuation. Price broke above 776.85, retested the breakout, found buyers, and closed the week back above resistance.
Continuation Hold Level:776.85
Bullish Defense Zone:747.34–758.61
Structural Invalidation: A loss of 776.85 would signal that the current continuation attempt is failing and could return SPY to consolidation inside the pattern. The larger bull flag itself remains structurally intact as long as 747.34 continues holding.
⸻
🔄 Structural Sequence — What Happened Last Week
1️⃣ Monday — Breakout
Monday was the first meaningful change in the daily structure.
SPY broke above:
the short-term descending trendline
the previously established 775.14 resistance
the major bull flag resistance at 776.85
That broke the short-term downtrend and moved the major bull flag into continuation.
For the first time in this extended consolidation, price wasn't simply approaching resistance.
It was trading above it.
⸻
2️⃣ Tuesday — Gap Into the Target Zone
Tuesday immediately tested how much momentum buyers actually had.
SPY gapped higher and pushed directly into the 779.81–785.75 target / resistance zone we've been watching.
That move reached the previous minor bull flag's first target at:
779.81 — Reached
It then came within less than a dollar of:
782.24 — Weekly Target 1
And that's where sellers stepped in.
This was not unexpected.
We've been treating this entire area as a likely place for profit-taking and resistance because several technically important targets are stacked almost directly on top of each other.
Tuesday gave us the first evidence that sellers are indeed willing to defend it.
⸻
3️⃣ Wednesday — Breakout Retest Begins
Wednesday pulled price back from the target zone.
Rather than immediately treating that weakness as a failed breakout, the important question became whether SPY could hold the structure it had just reclaimed.
That meant watching 776.85.
The pullback began testing the breakout instead of immediately destroying it.
⸻
4️⃣ Thursday — Buyers Defend the Breakout
Thursday continued the retest.
Price traded beneath the daily 10EMA, but buyers stepped in and defended the breakout area.
This is important.
Breaking resistance is one thing.
Breaking resistance, pulling back, and then finding buyers where sellers previously controlled price is much better confirmation.
That is what SPY gave us last week.
⸻
5️⃣ Friday — Continuation Resumes
Friday buyers took control again.
SPY pushed back above the breakout area and closed around 778.57, keeping the major bull flag continuation intact.
After:
breakout → target test → profit-taking → breakout retest
we now have price attempting the next continuation higher.
That leaves the targets immediately overhead back in focus.
⸻
📐 Immediate Structure Map
The daily chart is considerably cleaner than it was a week ago.
776.85 — Major Breakout Support
This is now the most important near-term level.
Previously, 776.85 was the ceiling.
Now I want to see it become the floor.
As long as SPY continues holding above it, the breakout remains healthy and I expect buyers to continue working toward the targets overhead.
If price falls back below 776.85, that does not automatically invalidate the entire major bull flag.
But it would tell us the current continuation attempt has failed and could send SPY back into another period of consolidation.
⸻
🎯 The Target Sequence
The roadmap above the breakout is now very clear.
779.81 — Previous Minor Target 1 — Reached
Tuesday's push satisfied this objective.
The level can still matter intraday, but it is no longer the primary upside objective.
782.24 — Weekly Target 1
This is now the immediate target.
SPY came within roughly $0.62 of reaching it last week.
As long as price continues holding above 776.85, I expect this level to be tested very soon.
785.75 — Previous Minor Target 2
This remains part of the same resistance cluster and sits between the weekly objective and the major daily target.
789.84 — Major Bull Flag Target 1
This is where my attention increasingly shifts once 782.24 is reached.
If SPY continues holding the breakout, I think the likely progression becomes:
782.24 → 785.75 → 789.84
And 789.84 is another area where I expect resistance.
⸻
⚠️ I Still Expect Resistance Around 789.84
Last week's breakout is bullish.
It does not change my expectation that this market is likely to need another rest before simply running straight toward the larger monthly objective.
The first meaningful test was the 779.81–785.75 zone.
We already saw sellers appear there Tuesday.
If buyers work through that cluster, the next major destination becomes:
789.84 — Major Daily Target 1
That's another place where I expect traders to lock in gains and where SPY could begin another period of consolidation.
So the path I'm watching now looks something like:
776.85 breakout → 782.24 weekly target → 785.75 → 789.84 major daily target → resistance / consolidation
That would still be an entirely healthy bullish progression.
In fact, given how weak trend strength remains on the higher timeframes, I would be more surprised to see SPY simply travel vertically through every target without encountering another meaningful pause.
⸻
🔍 Momentum Context
The price structure improved significantly last week.
The momentum picture improved somewhat, but it still hasn't given us full confirmation of a powerful new trend.
MACD
MACD continues improving, but I'm still watching for the stronger bullish confirmation we've discussed.
If MACD completes its bullish turn while price remains above 776.85, that would strengthen the case that SPY has enough momentum not only to reach the weekly target but continue toward 789.84.
That becomes especially important once the market begins challenging the resistance zone overhead.
⸻
ADX
ADX remains the biggest reason I'm not expecting a straight-line move.
Trend strength is still extremely weak.
That doesn't prevent price from moving higher.
We've already seen that.
But it does make sustained expansion less convincing.
Until ADX starts rising materially, I'm going to continue expecting:
breakout → advance → resistance → consolidation → next attempt
rather than assuming every breakout begins an uninterrupted trend.
⸻
DMI
DMI remains constructive, with DI+ maintaining the bullish advantage.
That supports the continuation thesis.
What I want to see now is expanding separation accompanied by rising ADX.
That would tell us the bullish direction is finally developing meaningful trend strength behind it.
⸻
TTM Squeeze
The Squeeze histogram continues expanding positively.
That's one of the better signs on the chart right now.
Momentum has been steadily building as price worked through resistance, and that supports another attempt higher.
The question is whether that momentum remains strong enough as SPY encounters the next cluster of targets.
⸻
🧭 What Happens Next
1️⃣ Does 776.85 Continue Holding?
This is now the first question.
The market has broken out.
Now the breakout needs to remain intact.
As long as 776.85 acts as support, the immediate bias remains bullish.
⸻
2️⃣ Does SPY Finally Reach 782.24?
I think this is increasingly likely.
SPY missed the target by less than a point last week and then successfully retested its breakout.
That leaves 782.24 directly in the market's path.
⸻
3️⃣ Can Buyers Work Through 785.75?
That would clear the remainder of the previous minor pattern's target structure.
At that point, there isn't much standing between price and the major bull flag's first objective.
⸻
4️⃣ What Happens at 789.84?
This is where I'll become more cautious again.
789.84 is the first target generated by the major pattern we've been following since July.
I expect that level to matter.
A push into it followed by profit-taking and another consolidation would fit the larger roadmap extremely well.
⸻
5️⃣ Does Momentum Finally Strengthen?
If MACD confirms and ADX begins turning higher during this process, then the market may prove stronger than I'm currently giving it credit for.
That would increase the probability that consolidation around 789.84 is relatively shallow and that SPY begins working toward:
806.36 — Major Daily Target 2
and eventually:
818.18 — Monthly Target 2
But we're not there yet.
⸻
🎯 Trading Plan
The important change this week is that we're no longer waiting for SPY to prove it can break the major resistance.
It already did.
Now we're trading a continuation environment as long as that breakout holds.
For intraday trading, that means I want to continue favoring names with the strongest bullish timeframe alignment while SPY remains above 776.85 and pushes toward the targets.
ORBI remains useful for identifying when that broader bullish pressure translates into intraday momentum.
But the closer SPY gets to:
782.24 → 785.75 → 789.84
the more aware we should become of profit-taking and reversals.
Those are not arbitrary numbers.
They are known higher-timeframe objectives where sellers have a reason to become more aggressive.
⸻
🎯 Bottom Line
The major daily bull flag has finally entered continuation.
Pattern State: Bull Flag Active — Continuation Confirmed
Pattern Start: 729.10
Low Anchor: 729.10
High Anchor: 776.85
Breakout / Continuation Hold Level: 776.85
Bullish Defense Zone: 747.34–758.61
Major Target 1: 789.84
Major Target 2: 806.36
Last week's sequence was constructive:
Monday: SPY broke the downtrend and resistance.
Tuesday: price gapped into the known target zone and sellers took profits.
Wednesday–Thursday: price pulled back and retested the breakout.
Thursday: buyers defended below the 10EMA.
Friday: SPY broke higher again and kept continuation intact.
The first minor target at 779.81 has now been reached.
The next roadmap is:
782.24 → 785.75 → 789.84
As long as SPY continues holding above 776.85, I expect the weekly target at 782.24 to be reached very soon, with price likely continuing toward the major bull flag's first target at 789.84 afterward.
That's where I expect another meaningful battle.
I still believe 789.84 could produce resistance, profit-taking, and another period of consolidation rather than immediate straight-up continuation.
If the market instead moves through that level while MACD confirms and ADX finally begins strengthening, then the larger push toward 806.36 and ultimately 818.18 becomes much more compelling.
For now, the bulls have done what we needed them to do:
They broke resistance, retested it, and defended the breakout.
Now we see how far they can carry it.
