
SPY Bull Flag at Risk as Bearish Momentum Builds
📆 DAILY CHART OUTLOOK — SPY
Week of October 26, 2026
Unfortunately, the daily chart isn't painting a much prettier picture heading into the new week.
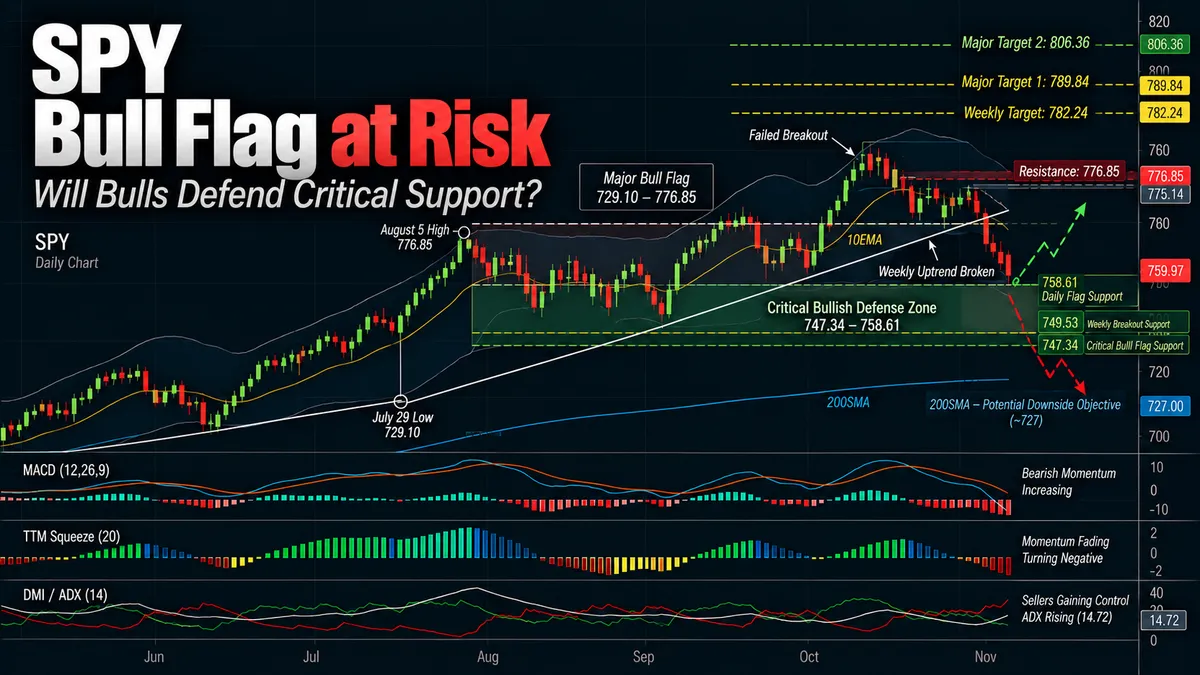
The major daily bull flag we've been following since August remains technically intact, but the momentum picture has deteriorated considerably, and price is now approaching the support levels that will determine whether this pattern survives.
For months, we've watched SPY consolidate while ADX steadily declined, warning us that the market wasn't developing enough trend strength to sustain another meaningful advance.
When SPY finally broke above 776.85 earlier this month, we were hoping that breakout would bring the momentum needed to carry price toward our weekly target at 782.24 and eventually the major daily bull flag's first target at 789.84.
Instead, the breakout failed, sellers regained control, and the market has spent the last two weeks moving lower.
Now, after losing the rising weekly trendline, we're seeing three important developments on the daily chart:
ADX is rising, with bears controlling direction.
MACD is crossing the zero line.
The TTM Squeeze histogram is rolling into negative momentum.
Together, those conditions make me increasingly confident that lower prices are ahead.
The question isn't whether the market is showing weakness anymore.
It is.
The question now is how much lower SPY needs to move before buyers step in and whether the major daily bull flag can survive that test.
📌 Pattern State
Pattern State: Bull Flag Active
Pattern Start: 729.10 (7/29 low)
Low Anchor: 729.10 (7/29 low)
High Anchor: 776.85 (8/5 high)
Active Bull Flag Levels
0% Support: 729.10
38.2% Flag Support: 747.34
61.8% Flag Support: 758.61
100% Resistance: 776.85
127.2% Target 1: 789.84
161.8% Target 2: 806.36
Pattern Confirmation: Bull flag established on 8/6.
Current Mode: Bearish retracement within the active major daily bull flag. The earlier breakout above 776.85 has failed, the rising trendline has broken, and price is testing the upper boundary of the pattern's bullish defense zone.
Bullish Defense Zone: 747.34–758.61
Immediate Support: 758.61
Critical Weekly Support: 749.53
Structural Invalidation: A daily close below 747.34 invalidates the active major bull flag. A new bearish pattern may then develop, but its structure and confirmation would need to be established before replacing the current pattern as our primary roadmap.
📉 The Major Bull Flag Is Approaching Its Most Important Test
The larger daily pattern has been our primary roadmap since August.
And despite several failed smaller patterns, nearly three months of consolidation, and increasingly weak momentum, the major bull flag has continued holding its structural support.
That remains true today.
But we're now approaching the area that will determine whether it stays that way.
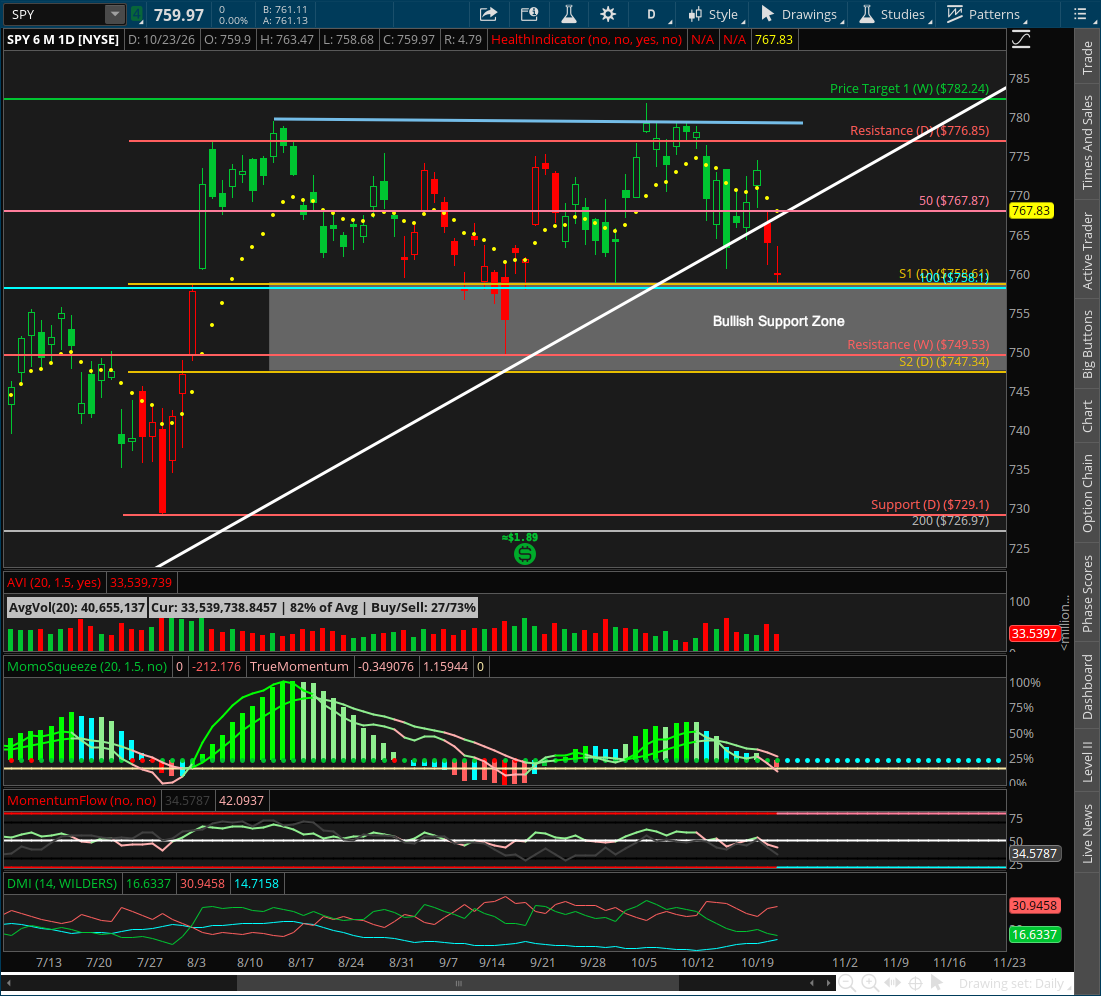
Last week, SPY closed at 759.97, just above our first major daily support level at 758.61.
Friday's low reached 758.68, coming within just seven cents of that support.
That's not an insignificant development.
After failing to sustain the breakout above 776.85, price has now retraced nearly the entire move back toward the major pattern's bullish defense zone.
And unlike several of the previous pullbacks, this one is occurring while the daily momentum indicators are beginning to align in favor of sellers.
The support zone is still holding, but the conditions surrounding this test are becoming increasingly bearish.
That makes the next few trading sessions particularly important.
🔄 How We Got Here
The recent price sequence tells us why the current support test matters.
1️⃣ The Breakout Above 776.85 Failed
Earlier this month, SPY finally broke above the resistance level that had contained price throughout the extended consolidation.
Initially, that was encouraging.
Price moved into our known target and profit-taking zone, coming close to reaching the first weekly target at 782.24.
But momentum never developed enough to sustain the move.
The market rejected the higher prices and fell back beneath the breakout.
That was our first warning.
2️⃣ A Lower-Timeframe Bear Flag Developed
During the week of October 12, the 30-minute and hourly charts developed a bearish flag.
That pattern broke down Friday, October 16, reaching its first target near 762.95.
At the time, we discussed how that bearish structure appeared to be directing price toward the major daily bull flag's support zone.
That scenario has continued developing.
3️⃣ The Rising Trendline Failed
Last week, buyers attempted to regain control but couldn't establish a sustained recovery.
Price continued weakening and ultimately broke beneath the rising trendline that had helped support the broader advance.
That breakdown was also visible on the weekly chart, where SPY lost its rising 50% Fibonacci fan.
The importance of that development is straightforward:
the market is no longer simply consolidating above rising support. It has begun breaking that support.
4️⃣ Price Arrives at the Bullish Defense Zone
By Friday, SPY had declined to 758.68 before closing at 759.97.
That puts price almost directly on the major bull flag's first support level at 758.61.
This is where the next meaningful decision begins.
Do buyers defend the pattern?
Or does selling continue toward the August weekly breakout at 749.53 and eventually the major daily invalidation level at 747.34?
Given the current momentum picture, I think that deeper retest is becoming increasingly likely.
🔍 Daily Momentum — Bears Are Gaining Control
This is the most concerning part of the daily chart.
We've spent months waiting for trend strength to return.
Now ADX is finally beginning to rise, but it isn't doing so with bulls controlling direction.
It's happening while sellers are gaining the advantage.
And several other momentum indicators are beginning to confirm that shift.
ADX — Trend Strength Is Rising
Daily ADX had fallen below 10 earlier this month.
That's exceptionally weak trend strength and was one of the reasons I remained skeptical of the previous breakout.
Since then, ADX has started moving higher.
Current ADX: Approximately 14.72
The reading remains relatively low, but the direction is important.
We've moved from a prolonged period of declining trend strength into one where directional strength is beginning to rebuild.
Unfortunately for bulls, the directional indicators tell us that sellers are currently benefiting.
This is the development I've been concerned about.
ADX is finally rising, but the move gaining strength is bearish.
If that continues, the probability of SPY breaking through nearby support increases.
DMI — Sellers Have the Advantage
DMI now clearly favors sellers.
DI-: Approximately 30.95
DI+: Approximately 16.63
That's a substantial separation.
The bears have taken directional control while ADX is beginning to rise.
This combination is considerably more concerning than the low-ADX consolidation we experienced throughout August and September.
During that consolidation, neither side could establish meaningful control.
Now sellers are beginning to do exactly that.
If DI- continues expanding while ADX rises, I expect additional pressure on the support levels immediately beneath us.
The bulls need to interrupt that process.
A successful defense of support accompanied by improving DI+ would be encouraging.
But as of Friday's close, sellers remain in control.
MACD — Crossing the Zero Line
MACD has also deteriorated.
After weakening throughout the recent pullback, momentum is now crossing the zero line.
That matters because we're no longer simply watching a bearish crossover within an otherwise positive momentum environment.
We're approaching a transition into negative momentum.
A sustained move below zero would add further confirmation that the current decline is developing into something more meaningful than another brief pullback.
Combined with rising ADX and bearish DMI separation, this is another reason I'm expecting lower prices before the market can establish a sustainable recovery.
TTM Squeeze — Negative Momentum Is Developing
The TTM Squeeze histogram is also rolling negative.
This is the third major development supporting the bearish outlook.
We've watched positive momentum steadily weaken since the recent rally toward the highs.
Now the histogram is transitioning toward another negative cycle.
What I want to see next is how much negative momentum develops compared with the previous downswing.
If the histogram begins producing increasingly negative readings, particularly deeper than those established during the September pullback, that would suggest sellers are developing stronger downside momentum.
And if that happens while ADX continues rising and DI- remains firmly above DI+, I'd become increasingly concerned about the major bull flag's ability to hold support.
On the other hand, if the histogram turns negative but fails to develop as much downside momentum as the previous cycle, that could provide an early clue that sellers are losing strength.
That's particularly important as SPY approaches the 749.53–747.34 support cluster.
The comparison between the current negative momentum cycle and the previous one may help us determine whether we're watching another consolidation or the beginning of a more substantial correction.
📐 Immediate Structure Map
The next support levels are now much more important than the resistance overhead.
758.61 — First Major Daily Support
This is the upper boundary of the established bullish defense zone.
SPY came within seven cents of testing it Friday.
I expect this level to be challenged almost immediately if selling continues into the new week.
A successful defense could produce a rebound.
But given the current momentum conditions, I wouldn't automatically interpret an initial bounce as confirmation that the correction has ended.
Buyers need to establish enough strength to do more than briefly interrupt the selling.
A sustained break below 758.61 would put the next major support cluster directly in focus.
749.53 — Weekly Breakout Support
This is where I think price is increasingly likely to head.
749.53 was the resistance level SPY broke above during the first week of August.
The market has spent nearly three months trading above that breakout.
Now, after losing the rising weekly trendline and developing bearish momentum on the daily chart, a retest looks increasingly likely.
This is an important level for two reasons.
First, it's the foundation of the weekly breakout we've been following throughout this consolidation.
Second, it sits immediately above the daily bull flag's critical support.
That creates a very important support cluster.
If buyers can defend it, the larger bullish roadmap remains viable.
If they can't, the market could be preparing for a more meaningful change in structure.
747.34 — Major Daily Bull Flag Invalidation
This is the level that ultimately decides whether the pattern we've been following since August survives.
747.34 is the lower boundary of the major daily bull flag's defense zone.
As long as price continues holding above it on a daily closing basis, the pattern remains active.
But a daily close beneath 747.34 invalidates the current bull flag.
And given the momentum changes we're seeing, I think that possibility deserves serious consideration this week.
A breakdown would mean the market has not only lost the rising trendline and weekly breakout support but also violated the major daily pattern that's guided our analysis for months.
At that point, I'd stop treating the current decline as another pullback within the bull flag.
Instead, I'd begin looking for the next bearish structure to develop.
⚠️ What Happens if 747.34 Breaks?
This is where the roadmap could change substantially.
If SPY closes below 747.34, the major daily bull flag would be invalidated.
That doesn't automatically mean a new bear flag is already confirmed.
But it would put us in a position where a new bearish pattern could begin forming and eventually become our primary roadmap.
And if that happens, I would expect the market to begin working toward the next major longer-term support area.
The Daily 200SMA
The daily 200SMA currently sits around 727 on the chart.
That area is particularly interesting because it's also near the original major bull flag's low anchor at 729.10.
If the market loses the 749.53–747.34 support cluster and bearish momentum continues strengthening, I believe a move toward that lower region becomes a realistic next objective.
And that's where I'd expect buyers to become much more interested in stepping back into the market.
A correction toward the 200SMA would represent a meaningful reset from the recent highs.
But I don't necessarily see that as the end of the larger bullish opportunity.
In fact, it could ultimately provide the kind of retracement needed to attract buyers, rebuild momentum, and prepare the market for another sustained advance.
The weekly chart's lower 61.8% Fibonacci fan would also be an important rising support reference during such a decline.
For now, however, that's the conditional bearish roadmap.
We still need a confirmed loss of 747.34 before replacing the active bull flag with a new bearish pattern.
🧭 What Happens Next
1️⃣ Does SPY Break 758.61?
This is the first question heading into the week.
Price is already sitting just above the upper boundary of the major defense zone.
Given rising ADX, bearish DMI separation, weakening MACD, and the Squeeze histogram rolling negative, I think the downside pressure is likely to continue.
A break below 758.61 would increase my confidence that the market is headed toward the next support cluster.
2️⃣ Does SPY Retest 749.53?
This is becoming my primary near-term expectation.
After losing the rising weekly trendline, the August breakout level is increasingly vulnerable to another test.
I expect buyers to become interested around 749.53, particularly given its proximity to the major daily flag support.
But we'll need to see whether that interest translates into an actual reversal.
Simply reaching support doesn't mean the market has found a bottom.
3️⃣ Can Bulls Defend 747.34?
This is the most important structural question.
If buyers defend the zone and price begins stabilizing, I would expect additional sideways consolidation.
That would allow the current selling pressure to diminish, momentum to reset, and potentially another Squeeze to develop.
If the market can rebuild enough strength, another bullish continuation attempt could eventually follow.
But if SPY closes below 747.34, the current bull flag is invalidated.
And the bearish roadmap becomes considerably more important.
4️⃣ Does a New Bear Flag Develop?
If the major bullish structure fails, I'll begin watching for the next bearish pattern.
I would expect the market to establish a new structure following the breakdown, potentially producing a bear flag that guides price toward the daily 200SMA.
That would give us a new pattern to follow rather than continuing to reference a bullish structure that is no longer valid.
Until then, the major daily bull flag remains our guiding pattern.
We don't need to anticipate a new one before the market actually establishes it.
5️⃣ What Does the Negative Squeeze Histogram Tell Us?
This could become one of the most useful momentum clues.
If the next negative cycle expands beyond the prior negative momentum readings, that would strengthen the bearish case.
If the histogram develops a shallower negative cycle while price tests major support, I'd begin watching more closely for signs that selling pressure is exhausting.
Combined with ADX and DMI, that should help us evaluate whether the move lower is gaining strength or beginning to lose momentum.
🎯 What if Bulls Hold Support?
There's still a realistic bullish outcome.
If SPY defends the 747.34–758.61 zone, the current major bull flag remains intact.
But I wouldn't automatically expect price to turn around and rally straight back toward the highs.
We've spent months watching this market struggle to develop trend strength.
And the recent pullback has made that weakness more obvious.
A successful defense could instead lead to another period of sideways consolidation.
That would allow sellers to finish the current move and give buyers time to establish a new foundation.
If that happens, I'd begin watching for momentum to stabilize, bearish directional pressure to diminish, and another compression structure to form.
Eventually, that could produce the volatility expansion needed to move SPY higher again.
The upside roadmap would remain:
767.87 — Near-Term Daily Resistance
776.85 — Major Bull Flag Resistance
782.24 — Weekly Target 1
789.84 — Major Daily Bull Flag Target 1
806.36 — Major Daily Bull Flag Target 2
But those upside targets are secondary for now.
First, the bulls need to prove they can defend support.
🎯 Intraday Trading Plan
For now, my attention remains focused on intraday opportunities.
The broader market is approaching a major technical decision, and I don't see much value in trying to predict the exact day or price where the correction will end.
We have a bearish daily momentum configuration developing while price approaches an important higher-timeframe support zone.
That combination can produce sharp moves in either direction.
Sellers may continue pressing the market lower.
But as SPY approaches 749.53–747.34, buyers may begin stepping in aggressively.
That could create considerable volatility, including short-lived rebounds that don't necessarily change the larger bearish outlook.
So rather than trying to force a swing trade before the market establishes its next structure, I'm continuing to focus on the bullish and bearish scanners alongside ORBI.
When sellers are in control, I want to focus on the stocks showing the strongest bearish alignment across multiple timeframes.
When buyers step in and begin establishing bullish momentum, I want to identify the names with the strongest bullish alignment.
The important thing is that the 15-minute, 30-minute, 1-hour, and higher timeframes are supporting the direction of the trade.
I don't need to guess whether SPY will bounce at 758.61 or continue toward 749.53.
I need to recognize when momentum is developing and identify the names best positioned to take advantage of it.
And with the market approaching major support, I want to remain especially disciplined about taking profits on the shorter intraday moves rather than assuming every directional push will develop into a lasting trend.
Follow the direction, trade the strongest aligned names, and let the market establish its next major pattern before making larger commitments.
🎯 Bottom Line
The daily chart continues to deteriorate.
After failing to sustain the breakout above 776.85, SPY has now broken its rising trendline and moved almost directly into the major daily bull flag's support zone.
The pattern we've been following since August remains active:
Pattern State: Bull Flag Active
Pattern Start: 729.10 (7/29 low)
Low Anchor: 729.10 (7/29 low)
High Anchor: 776.85 (8/5 high)
Bullish Defense Zone: 747.34–758.61
Structural Invalidation: Daily close below 747.34
Major Target 1: 789.84
Major Target 2: 806.36
But the momentum picture has changed considerably.
ADX is rising, and bears have directional control.
MACD is crossing the zero line, warning that the broader momentum picture is deteriorating.
The TTM Squeeze histogram is rolling negative, suggesting another period of downside momentum may be developing.
Together, these conditions make me expect additional selling.
The immediate support roadmap is:
758.61 → 749.53 → 747.34
I think a retest of the August weekly breakout at 749.53 is now highly likely.
And whether buyers can defend that level alongside 747.34 will determine whether the major daily bull flag survives.
If support holds, I expect more consolidation while the market works to rebuild momentum for another eventual push higher.
If 747.34 breaks on a daily closing basis, the current bull flag is invalidated, and I'll begin watching for a new bearish pattern to develop.
That could open the door to a deeper correction toward the daily 200SMA near 727, where I'd expect buyers to become much more interested in rebuilding the larger uptrend.
The longer-term bullish outlook hasn't necessarily disappeared.
But the market is telling us it may need a more meaningful reset before buyers can regain control.
And with momentum currently favoring sellers, I'm not interested in forcing bullish trades simply because support is approaching.
Until the larger structure becomes clearer, I'm staying focused on the bullish and bearish scanners, using ORBI to trade the strongest intraday opportunities in whichever direction momentum is actually moving.
There's no need to guess where the bottom will be.
The bulls are running out of room. Now we find out whether they can defend the major bull flag or whether a new bearish pattern is about to take control.
