
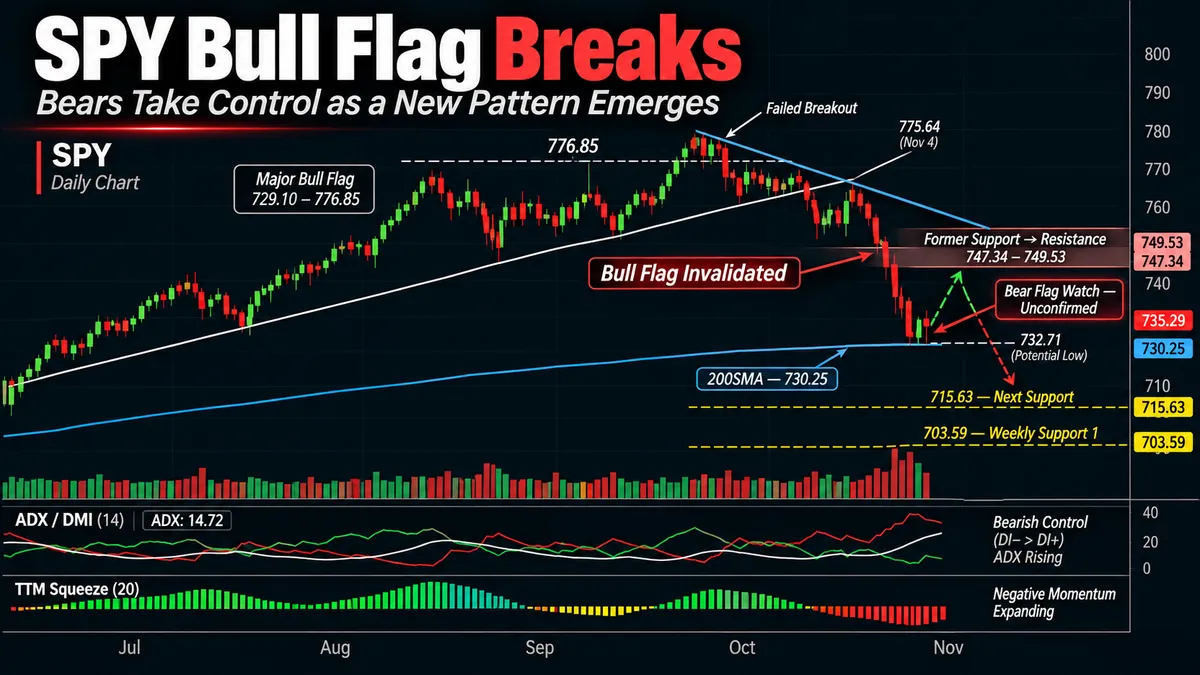
SPY Bull Flag Breaks as Bearish Momentum Accelerates
📆 DAILY CHART OUTLOOK — SPY
Week of November 9, 2026
Last week, the market did almost exactly what we warned traders to prepare for.
Going into the week, we were watching for a potential relief rally following the previous Friday's sharp selloff.
I specifically cautioned against mistaking that recovery for the end of the correction. Instead, I was looking for price to rally into the daily 50SMA or descending trendline, encounter resistance, and eventually begin another leg lower.
That's precisely what happened.
Monday produced a higher high and higher low. Tuesday remained inside Monday's range. Wednesday brought the relief rally we anticipated, but buyers were rejected near the descending trendline and 50SMA.
Then Thursday changed everything.
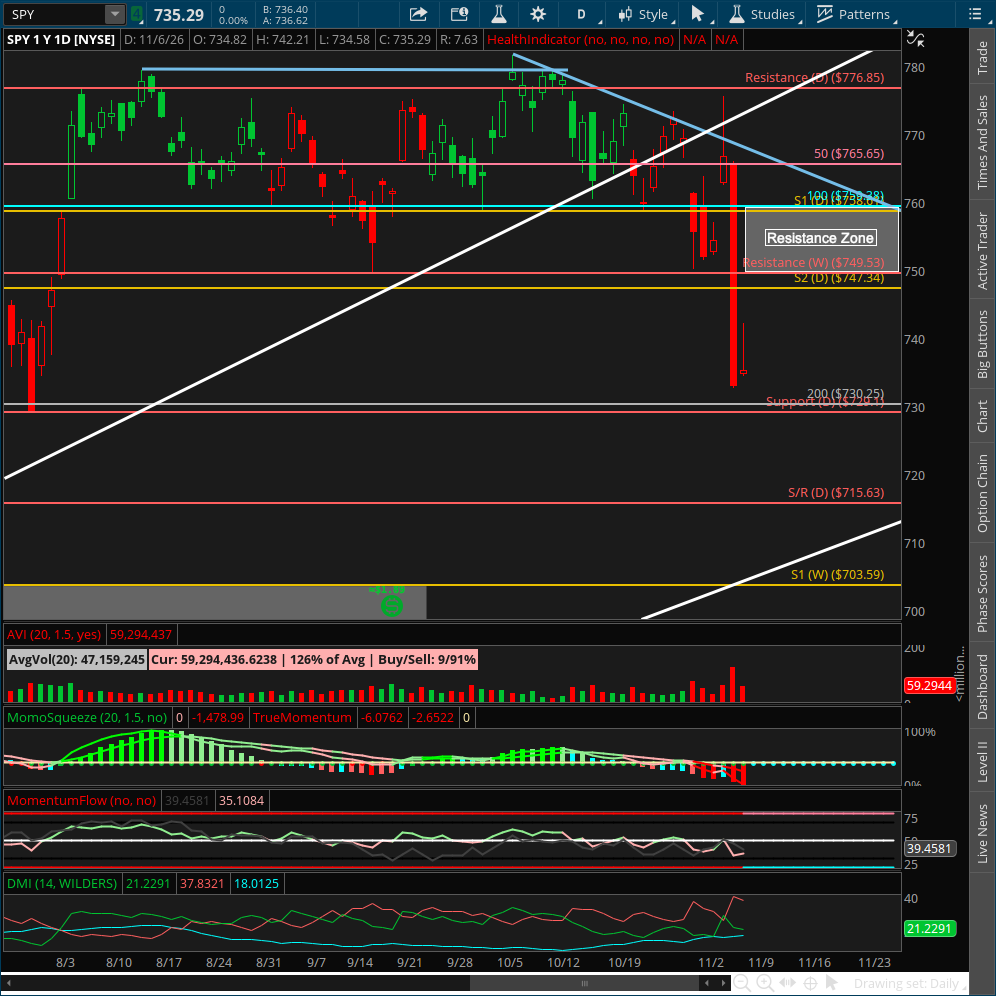
SPY suffered a sharp selloff, falling approximately 4.34%, breaking decisively beneath the 747.34 support level that had kept our major daily bull flag intact since August.
Price continued toward the daily 200SMA in after-hours trading, where buyers finally began stepping in.
Friday brought another recovery attempt, but sellers rejected the early strength, leaving SPY closing at 735.29, near the lower end of the day's range.
The conclusion is straightforward:
The major daily bull flag has been invalidated. Bears have taken control, and we're now watching for the formation of a new bearish continuation pattern.
But there's an important distinction.
The bearish move is underway.
The new bear flag has not yet fully formed.
And that distinction will determine how we approach the next several weeks.
📌 Pattern State
Pattern State: Bear Flag Watch
Pattern Start: 775.64 (11/4 high)
High Anchor: 775.64 (11/4 high)
Low Anchor: Not yet established
Potential Low Anchor: 732.71 (11/5 low) — Unconfirmed
Trigger: A daily candle must break the current declining price sequence by establishing both a higher high and a higher low relative to the preceding candle. This will establish the initial countertrend structure needed to identify the new bear flag's low anchor.
Current Mode: Bearish directional expansion following the invalidation of the previous major daily bull flag. Sellers remain in control while price consolidates near the daily 200SMA.
Pattern Targets: Not yet established. Fibonacci downside targets will be calculated once the bear flag's structural anchors are confirmed.
Bearish Continuation Trigger: Once the new bear flag has formed, a daily close below its confirmed low anchor and the daily 200SMA would provide stronger confirmation of the next bearish continuation.
Previous Pattern — Invalidated
The previous bull flag, which began on July 29 and established its high on August 5, has been invalidated. Its critical support at 747.34 was broken when SPY closed below that level on Thursday, November 5.
That bullish pattern is no longer active and will not guide our daily analysis going forward.
Until the new bear flag establishes its anchors, we're following the current bearish price structure, known resistance and support levels, and momentum conditions.
📉 The Major Bull Flag Has Finally Failed
For nearly three months, we've followed the major daily bull flag established in early August.
Despite multiple failed minor patterns, weak trend strength, and an extended period of sideways consolidation, the larger bullish structure continued holding above 747.34.
That support was the reason we remained technically bullish on the daily pattern even as our momentum outlook became increasingly cautious.
But Thursday changed the structure.
SPY closed decisively beneath 747.34, invalidating the major bull flag we've followed since August.
And that breakdown did not occur in isolation.
We had already seen:
The rising weekly 50% Fibonacci fan break
The weekly August breakout at 749.53 come under pressure
Sellers take directional control on weekly DMI
Daily ADX begin rising with DI- above DI+
MACD deteriorate
The daily TTM Squeeze histogram turn negative
Now price has confirmed the deterioration.
The market is no longer simply threatening to break its bullish structure.
It has broken it.
And that means the next pattern we establish will need to reflect the bearish environment that has emerged.
🔄 Structural Sequence — What Happened Last Week
1️⃣ Monday — Buyers Attempt to Stabilize
Monday provided the first indication that buyers were attempting to recover from the previous week's selling.
Price established a higher high and higher low, beginning a potential short-term recovery.
That wasn't surprising.
After several weeks of declining prices, a relief rally was a realistic possibility.
But one bullish session wasn't enough to change the larger picture.
The monthly chart was beginning its cooling process, the weekly trend had already broken, and daily momentum remained bearish.
The question was whether buyers could develop enough strength to reclaim resistance.
2️⃣ Tuesday — Inside Day Extends the Structure
Tuesday traded inside Monday's range.
That maintained the developing price structure without establishing a meaningful new directional move.
Inside bars are important to interpret correctly.
They don't automatically terminate the preceding directional sequence.
Instead, they can extend the consolidation while the market prepares for its next expansion.
At that point, we still had no confirmation that buyers were regaining control of the larger daily trend.
We needed to see how price would behave when it encountered overhead resistance.
3️⃣ Wednesday — The Relief Rally Meets Resistance
Wednesday provided the recovery attempt we had been anticipating.
SPY rallied toward the intersection of the descending daily trendline and the 50SMA.
The session established a high of:
775.64 — November 4 High
This becomes the high anchor we're watching for the developing bearish pattern.
But rather than breaking decisively through resistance and reestablishing bullish control, price was rejected.
That was the critical development.
The recovery had carried price back into an area where sellers were willing to become aggressive.
And with the broader monthly, weekly, and daily momentum picture already deteriorating, that rejection provided the warning we were looking for.
The relief rally had reached resistance. Now we needed to see whether sellers would follow through.
They did.
4️⃣ Thursday — The Major Bull Flag Breaks
Thursday was the decisive session.
SPY sold off aggressively, falling approximately 4.34% and breaking through the major daily support that had remained intact since August.
Price moved beneath:
749.53 — Weekly Breakout Support
and
747.34 — Major Daily Bull Flag Support
The close below 747.34 officially invalidated the previous bullish pattern.
The selling continued toward the daily 200SMA during after-hours trading, where buyers began stepping in.
Thursday's regular-session low was:
732.71
That is currently our leading candidate for the new bear flag's low anchor.
But it is not confirmed yet.
We need the next part of the pattern's price structure to develop before determining whether Thursday's low becomes the definitive anchor.
That may happen quickly.
Or the market may need another week or two of consolidation before the pattern becomes clear.
5️⃣ Friday — Early Recovery Rejected
Friday opened modestly higher following Thursday's aggressive selling.
Buyers initially attempted to extend the recovery, pushing SPY as high as 742.21.
But sellers stepped back in.
The recovery faded, and SPY eventually closed at 735.29, close to its opening price and session low.
That is not an encouraging candle for bulls.
It tells us buyers were able to interrupt the selling, but they weren't able to sustain the recovery.
And with the daily 200SMA sitting just beneath current prices, the market is now consolidating around another important technical reference.
The next question is whether buyers can build a meaningful countertrend recovery or whether sellers will push directly through the remaining support.
⚠️ The New Bear Flag Is Beginning to Take Shape
This is now the primary pattern development I'm watching.
The major bull flag has been invalidated.
The initial bearish move has occurred.
And we have a known high anchor from Wednesday, November 4.
But we don't yet have a confirmed low anchor.
High Anchor — 775.64
Wednesday's high at 775.64 establishes the starting reference for the potential new bear flag.
That is the high from which the latest bearish expansion developed.
Potential Low Anchor — 732.71
Thursday's low at 732.71 is currently the leading candidate.
But the market could still print another low before the necessary countertrend structure develops.
That's why I'm not assigning this value as the confirmed pattern low yet.
What Confirms the New Pattern?
I'm watching for a daily candle that breaks the current downward sequence by producing:
A higher high AND a higher low relative to the preceding candle.
That would establish the initial reversal in the immediate price sequence and give us the structure needed to identify the bear flag's low anchor.
Inside bars and outside bars do not independently end the current sequence; they extend it until the required structural confirmation occurs.
Once that happens, we can establish the pattern's Fibonacci levels and projected downside targets.
Until then, we're monitoring a developing bear flag, not an active confirmed one.
That's important because I don't want to manufacture price targets from a pattern whose anchors haven't yet been established.
📐 Immediate Structure Map
The market has several important technical levels to work through from here.
But their roles have changed.
Support levels that previously defended the bull flag are now potential resistance during recovery attempts.
1️⃣ 747.34–749.53 — Former Support, Now Resistance
This is the first important horizontal resistance cluster above current price.
747.34 — Former Major Daily Bull Flag Support
749.53 — Former Weekly Breakout Support
Both levels have now been broken.
That makes this area particularly interesting if SPY begins another relief rally.
Previously, buyers defended these levels to keep the bullish structure intact.
Now sellers may begin defending them from below.
A recovery into this zone followed by rejection would reinforce the bearish continuation outlook.
And given how quickly the market has declined, I wouldn't be surprised to see price attempt another recovery before the next major move lower.
2️⃣ Daily 100SMA and 758.61–759.19 Area
Above the first resistance cluster sits another important technical area.
The daily 100SMA is positioned near the former upper bull flag defense zone around 759.
We also have the previous pattern's 758.61 support reference.
Together, these create another potential resistance region if the market manages a stronger recovery.
As long as SPY remains beneath the 100SMA, I'll continue treating rallies with skepticism.
A bounce toward this area could provide a useful opportunity to evaluate whether sellers are preparing for the next leg lower.
But again, the rejection needs to confirm.
Resistance is where we look for the setup. It isn't the setup itself.
3️⃣ Descending Daily Trendline and 50SMA
The newly established descending trendline remains another important resistance reference.
Wednesday's failed rally demonstrated why this area matters.
Price moved higher, encountered that trendline and the 50SMA, and was rejected.
The daily 50SMA is currently around 765.65.
That gives us a higher resistance reference if buyers produce a more substantial relief rally.
However, I don't necessarily expect price to recover that far before sellers attempt another move lower.
The immediate resistance cluster around 747.34–749.53 may be enough to stop a recovery.
We'll let price tell us.
🎯 The 200SMA Is Now the Immediate Decision Point
The daily 200SMA was one of the major downside objectives we discussed before the bull flag failed.
Last week, price reached that area in after-hours trading.
The moving average is now sitting around:
730.25 — Daily 200SMA
That puts it directly beneath current prices.
We also have the previous July low near 729.10.
This is an important area where buyers may attempt to stabilize the market.
But after Thursday's selling, I'm not assuming the 200SMA will hold simply because it is a widely followed moving average.
A brief bounce is entirely possible.
So is a period of sideways consolidation.
But if the market develops a confirmed bear flag and subsequently closes below both its low anchor and the 200SMA, that would become a much stronger signal that the next bearish expansion is underway.
And that would shift our attention toward the next established support levels.
📉 The Next Downside Objectives
Until the new bear flag forms, we don't have its actual Fibonacci extension targets.
But we do have known historical support levels.
And those give us a preliminary roadmap.
715.63 — Previous Daily Support / Resistance
This is the first established support reference beneath the current 200SMA area.
If sellers break through the moving average and continue lower, 715.63 becomes a logical area to watch for the next reaction.
It may provide temporary support or another location where buyers attempt to interrupt the decline.
But given the developing weekly correction, I wouldn't automatically expect it to produce a sustained reversal.
703.59 — Weekly Support 1
This is the next major higher-timeframe objective.
We've been discussing 703.59 throughout the weekly analysis as the upper boundary of the broader support zone where I expect buyers to become increasingly interested.
If the daily bear flag develops and eventually confirms a continuation lower, this level becomes particularly important.
It's also near the broader region where the weekly 61.8% Fibonacci fan may become relevant as the correction progresses.
That combination could make the area more attractive for buyers looking to rebuild longer-term positions.
689.70–675.22 — Deeper Weekly Support
If the correction extends beyond 703.59, the next major support references become:
689.70 — Former Monthly Resistance
675.22 — Weekly Support 2
Together with 703.59, these define the broader weekly support region we've been watching.
I expect buyers to become increasingly interested as the market approaches that area.
But the exact destination will depend on the momentum behind the decline and the structure of the new bear flag once it forms.
For now, the immediate preliminary downside roadmap is:
730.25 → 715.63 → 703.59
With 689.70–675.22 remaining the deeper weekly support region if selling continues.
🔍 Daily Momentum — Bears Are Strengthening
The daily indicators are now showing the kind of bearish alignment we've been anticipating.
This is no longer just a market struggling to develop bullish momentum.
Sellers are establishing directional control.
ADX — Bearish Trend Strength Is Rising
Daily ADX has now climbed to approximately:
21.23
That's a significant change from the readings below 10 we were seeing earlier in October.
At that time, the market was showing exceptionally weak trend strength as SPY continued consolidating near its highs.
Now ADX has more than doubled from those lows.
And the direction of the trend is bearish.
That combination makes the current decline considerably more concerning than the smaller pullbacks we experienced throughout August and September.
Trend strength is increasing, and sellers are benefiting.
If ADX continues rising, I'd expect the bearish move to remain the dominant directional opportunity.
DMI — Sellers Remain Firmly in Control
The latest DMI readings are approximately:
DI-: 37.83
DI+: 18.01
That's a substantial bearish directional advantage.
Sellers remain firmly in control of the daily trend.
And with ADX continuing to rise, that separation is becoming more meaningful.
This is the combination we were watching for as the monthly and weekly charts began deteriorating.
The bulls have not yet demonstrated the kind of strength necessary to challenge that directional advantage.
And until they do, I remain skeptical of recovery attempts.
A short-term rally can occur even while DMI remains bearish.
But a sustainable bullish recovery would require considerably more evidence than one or two strong sessions.
MACD — Bearish Momentum Remains in Control
MACD has continued deteriorating throughout the correction.
The weakening momentum we observed before the major bull flag failed has now translated into a significant breakdown in price.
The indicator remains part of the broader bearish picture.
What matters most now is how momentum behaves during the next potential relief rally.
If price recovers toward resistance while MACD remains weak, that would reinforce the possibility that the bounce is simply a countertrend recovery.
If momentum begins improving materially, I'd be more cautious about assuming an immediate continuation lower.
But at present, the directional evidence continues favoring sellers.
TTM Squeeze — Negative Momentum Expands
The daily TTM Squeeze histogram has moved decisively into negative territory.
And last week's selling produced a significant expansion in bearish momentum.
That's important.
We've been watching the Squeeze transition from weakening positive momentum into a new negative cycle.
Now the bearish histogram is expanding as price breaks support.
That provides additional confirmation that the current decline is developing meaningful directional force.
But the next phase will be just as important.
As the market consolidates following this sharp selloff, I'll be watching whether the histogram:
Continues producing deeper negative readings
Begins moderating while price stabilizes
Or eventually rotates back toward positive momentum
Expanding negative readings would support another bearish continuation.
Shallower readings during consolidation could suggest sellers are temporarily exhausting the current move.
But that wouldn't necessarily mean the broader correction is finished.
It may simply mean the market is preparing the countertrend rally needed to establish the next bear flag.
⚠️ Don't Mistake the Next Relief Rally for a Reversal
This is one of the most important things I want readers to understand heading into the new week.
Thursday's selloff was unusually aggressive.
And after a move like that, it's entirely reasonable to expect buyers to step in.
We may see a sharp recovery.
We may even see several bullish sessions.
But that doesn't automatically mean the correction is over.
Remember the larger picture.
Monthly: Seven consecutive months of overbought RSI, with the cooling process now underway.
Weekly: The August breakout has failed, sellers are gaining trend strength, and the broader correction is developing.
Daily: The major bull flag has been invalidated, ADX is rising with DI- above DI+, and the TTM Squeeze histogram is expanding negatively.
Those conditions won't disappear because price rallies for a few sessions.
In fact, a countertrend recovery is exactly what may be needed to establish our next bear flag.
That's why I want to see how price behaves near:
747.34–749.53
and potentially:
758.61–765.65
If sellers return around those resistance levels, that would support the bearish continuation thesis.
The next recovery may be an opportunity to position for the decline rather than evidence that the decline has ended.
🧭 What Happens Next
1️⃣ Does the New Bear Flag Establish Its Low Anchor?
This is the first structural development I'm watching.
Our high anchor is already known:
775.64 — November 4
Our low anchor is not yet confirmed.
Thursday's 732.71 remains the leading candidate.
I want to see a daily candle establish a higher high and higher low relative to the preceding candle.
That will help us determine whether the initial bearish move has completed and whether the countertrend portion of the bear flag is developing.
Once the pattern forms, we'll calculate the Fibonacci extension levels and establish more precise downside targets.
2️⃣ Does SPY Rally Into Former Support?
A recovery into 747.34–749.53 would provide an important test.
Those were major support levels during the previous bullish structure.
Now they're potential resistance.
If sellers reject price there, that would reinforce the bearish thesis.
A larger recovery toward the 100SMA, descending trendline, or 50SMA could provide another resistance opportunity.
But I want to see the actual rejection before assuming the next decline has begun.
3️⃣ Does Price Close Below the Confirmed Bear Flag Low and 200SMA?
Once the new bear flag establishes itself, this becomes the critical continuation trigger.
A daily close below the confirmed low anchor and the daily 200SMA would strengthen the case that the next leg lower is underway.
That is when the new pattern's Fibonacci targets become especially useful for managing bearish trades and identifying potential profit-taking areas.
Until then, I'm not going to treat Thursday's low as a confirmed anchor or assign targets the market hasn't established.
4️⃣ Does 715.63 Become the Next Support Test?
If price breaks the 200SMA and bearish momentum continues expanding, the next established daily reference is 715.63.
That's where I'll begin watching for another potential reaction from buyers.
But my larger expectation remains that the correction could eventually carry SPY toward the weekly support region.
5️⃣ Does SPY Reach 703.59?
This is the first major weekly support beneath the current daily structure.
I believe the correction has a realistic path toward 703.59 if the new bear flag forms and eventually confirms a continuation lower.
And if selling persists, the broader 703.59–675.22 weekly support zone becomes increasingly important.
That's where I expect buyers to make a more meaningful attempt at rebuilding the longer-term uptrend.
But the process may take time.
🎯 Trading Strategy — Let the New Pattern Form
I remain interested in bearish opportunities.
But after Thursday's sharp selloff, I'm not interested in chasing price lower without a clearly defined setup.
A recovery may provide a better entry.
And the new bear flag should eventually provide a clearer framework for managing the next leg down.
For bearish swing trades, I'm particularly interested in watching the stocks that previously led the market higher.
Those names may now be developing their own bearish continuation patterns.
I'll be looking for:
Failed rallies into resistance
SwingTraderPro Pulling Back or Breakdown signals
Rising ADX with DI- above DI+
Bearish momentum expansion
Multi-timeframe alignment supporting continuation lower
Defined-risk bearish option spreads remain one way to express those setups when the anticipated move, expiration, and spread pricing justify the trade.
But I want to emphasize patience.
The market has already produced a substantial decline. The next attractive short may come after a recovery, not after another emotional selloff.
I would rather allow the new structure to form and establish logical entry, invalidation, and profit-taking levels.
There's no reason to rush.
⚡ Intraday Trading — Expect Whipsaw Price Action
Until the new daily pattern confirms, I expect the market to remain volatile.
Thursday's selloff was aggressive.
Friday's recovery failed.
And now price is hovering near the daily 200SMA.
That environment could produce sharp intraday moves in either direction.
Buyers may attempt to defend the moving average.
Sellers may continue pressing the market lower.
And relief rallies may develop quickly before being rejected.
That's why I'm continuing to focus on the bullish and bearish scanners alongside ORBI.
I want to trade the names with the strongest directional alignment across multiple timeframes rather than assuming every session must follow the larger bearish outlook.
When buyers control the immediate move, bullish intraday opportunities may still exist.
When sellers regain control, bearish setups become the priority.
The goal is to trade the momentum that's actually developing, not force every move to fit our larger directional thesis.
And during this correction, I'm particularly interested in taking profits on shorter moves rather than assuming every intraday breakout or breakdown will become a sustained trend.
🎯 Bottom Line
Last week was the decisive breakdown we've been anticipating.
The major daily bull flag that guided our analysis since August is now invalidated.
The sequence played out almost exactly as expected:
Monday: Higher high and higher low.
Tuesday: Inside day.
Wednesday: Relief rally rejected near the descending trendline and 50SMA.
Thursday: Aggressive selloff, breaking beneath 747.34 and reaching the 200SMA area after hours.
Friday: Early recovery rejected, with SPY closing at 735.29 near the lower end of the session.
We're now monitoring a new bearish structure:
Pattern State: Bear Flag Watch
Pattern Start: 775.64 (11/4 high)
High Anchor: 775.64 (11/4 high)
Low Anchor: Not yet established
Potential Low Anchor: 732.71 (11/5 low)
Confirmation Requirement: Higher high and higher low relative to the preceding daily candle
The next important levels are:
747.34–749.53 — Former Support / Immediate Resistance
~759 — Daily 100SMA Resistance Area
765.65 — Daily 50SMA
732.71 — Potential Bear Flag Low Anchor
~730.25 — Daily 200SMA
715.63 — Previous Daily Support
703.59 — Weekly Support 1
The bears now control daily directional momentum, and ADX is rising as the TTM Squeeze histogram expands negatively.
That's precisely the combination we've been watching for.
I expect the correction to continue developing, potentially carrying SPY toward 715.63 and eventually 703.59 if the new bearish pattern confirms.
But I don't necessarily expect the next leg lower to begin immediately.
After Thursday's sharp decline, another period of consolidation or a convincing relief rally would not surprise me.
In fact, that recovery may be exactly what establishes our next bear flag.
Once the pattern forms, we'll have much clearer Fibonacci targets for managing the next bearish continuation.
Until then, I'm staying focused on the resistance zones overhead, the daily 200SMA beneath us, and the developing bearish structures across our former market leaders.
The bull flag is gone. The bears are in control. Now we wait for the new pattern to show us where the next leg lower begins.
Stay calm, remain patient, and don't confuse short-term buying pressure with a confirmed reversal of the larger correction.
Let the structure form. Let momentum confirm. Then trade the setup.
