
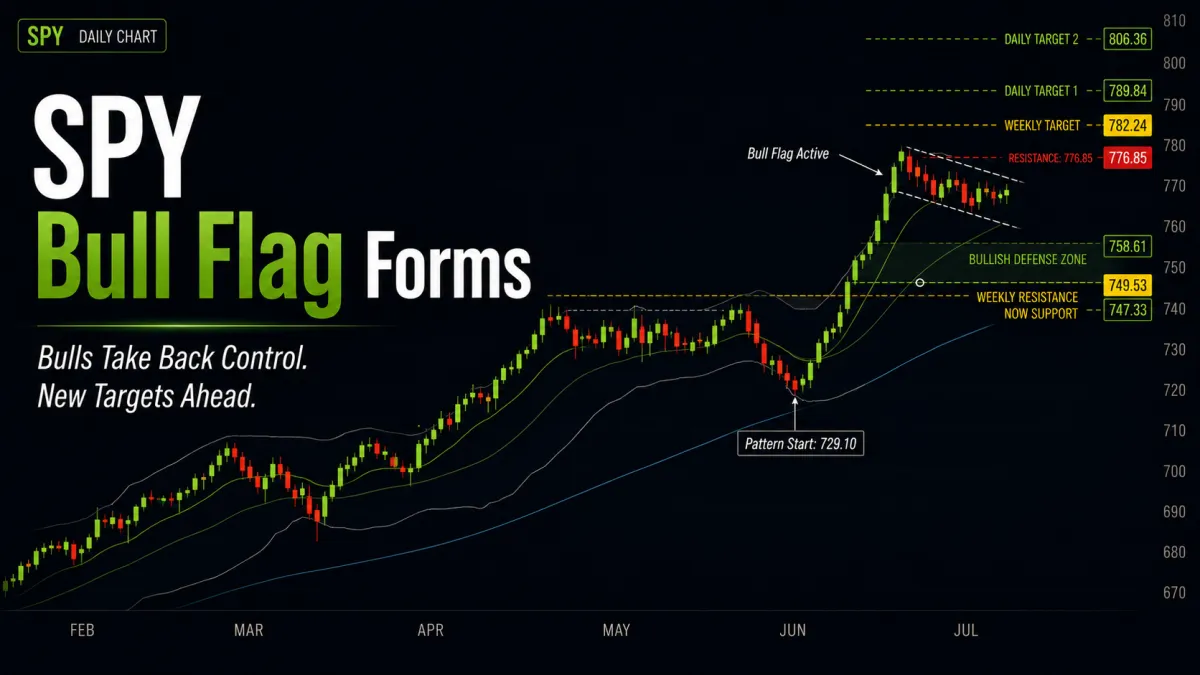
SPY Bull Flag Forms as Bulls Take Back Control

📆 DAILY CHART OUTLOOK — SPY
Week of August 10, 2026
The bull flag we were waiting for has officially formed.
Going into last week, SPY was on Bull Flag Watch after establishing its new anchor low at 729.10 on 7/29. What we still needed was the first lower-high / lower-low candle to establish the opposite anchor and complete the pattern.
We got it Thursday.
More importantly, the pattern formed only after buyers broke SPY decisively through weekly resistance, with momentum confirming the move.
The bulls have taken back control.
Now the question shifts from whether the bullish structure will form to how price works through the early stages of this new pattern before attempting its next major continuation higher.
⸻
📌 Pattern State
Pattern State: Bull Flag Active
Pattern Start: 729.10 (7/29 low)
Low Anchor: 729.10 (7/29 low)
High Anchor: 776.85 (8/5 high)
Active Bull Flag Levels
0% Support: 729.10
38.2% Flag Support: 747.33
61.8% Flag Support: 758.61
100% Resistance: 776.85
127.2% Target 1: 789.84
161.8% Target 2: 806.36
Current Mode: Bull flag active, early consolidation beneath pattern resistance.
Structural Invalidation: A close below 747.33 would break the lower boundary of the bull flag defense structure and materially weaken the current bullish pattern.
⸻
🔄 Structural Sequence — What Happened
1️⃣ Monday — Bulls Break Weekly Resistance
Monday delivered the move we’d been waiting for.
SPY gapped above weekly resistance at 749.53 and pushed sharply higher.
More importantly, momentum confirmed the breakout.
DI+ crossed above both DI- and ADX, while ADX began rising, giving us confirmation that this wasn’t simply another weak attempt at resistance.
Buyers had taken control.
⸻
2️⃣ Tuesday — Breakout Accelerates
Tuesday continued the move with force.
Price pushed substantially higher as the market expanded away from the consolidation zone that had contained it for weeks.
The developing bull flag still wasn’t complete because price continued making higher highs and higher lows.
We still needed the first lower-high / lower-low candle to establish our pattern high.
⸻
3️⃣ Wednesday — Anchor High Established
Wednesday produced another gap higher and pushed SPY to 776.85, establishing what would become the high anchor of the new pattern.
Price was now trading outside the upper Bollinger Band before pulling back during the session.
That was our first warning that, while momentum remained extremely bullish, price was becoming stretched in the short term.
The eventual pattern high was now in place.
⸻
4️⃣ Thursday — Bull Flag Forms
Thursday finally printed the lower high and lower low we’d been waiting for.
That completed the new bull flag.
Our structure is now defined by:
Low Anchor: 729.10
High Anchor: 776.85
The market has moved from Bull Flag Watch to Bull Flag Active.
⸻
5️⃣ Friday — Buyers Press Back Toward Resistance
Friday buyers stepped back in and pushed price higher toward the upper Bollinger Band again.
SPY closed at 773.26, leaving price just beneath the newly established bull flag resistance at 776.85.
That puts the market within striking distance of both the pattern breakout and our first weekly target.
⸻
📐 Immediate Structure Map
The structure is bullish, but price is stretched.
Immediate Resistance
776.85 — Bull Flag Resistance
A confirmed break above this level puts the new daily continuation targets into play.
Weekly Target
782.24 — Weekly Target 1
This sits only slightly above the bull flag breakout level and is therefore likely to become the first major test if buyers push through 776.85.
Daily Targets
789.84 — Daily Target 1
806.36 — Daily Target 2
Bullish Defense Zone
758.61 — Upper Bull Flag Support
747.33 — Lower Bull Flag Support
Weekly resistance at 749.53 also sits almost directly alongside the lower portion of this defense structure.
That makes the 747–750 area especially important if SPY eventually pulls back.
⸻
🔍 Momentum Context
Momentum has shifted decisively back toward the bulls.
• MACD has turned strongly higher
• DMI has shifted bullish
• DI+ has surged above DI-
• ADX is rising
• TTM Squeeze momentum is expanding positively
• RSI has pushed above 70
• price remains above former weekly resistance
The concern isn’t weak momentum anymore.
It’s short-term extension.
Price has repeatedly pressed outside the upper Bollinger Band while RSI is approaching an overbought stance.
That doesn’t mean the rally has to stop.
Strong trends can remain overbought far longer than traders expect.
But it does mean chasing price becomes increasingly unattractive as SPY approaches 776.85–782.24.
⸻
⚠️ Important Structural Note
The market may be setting up for two different things simultaneously:
a near-term push higher and a subsequent consolidation.
A retest of 776.85 and the first weekly target at 782.24 looks increasingly likely.
But another strong push higher would probably leave price stretched outside the Bollinger Bands while momentum moves deeper into overbought territory.
That creates the conditions where a breakout can initially succeed before price pulls back to make room for the larger trend.
That would not necessarily be bearish.
In fact, a pullback toward the newly established bullish defense zone could be exactly what this pattern needs before a more sustainable continuation toward the upper targets.
⸻
🧭 What Happens Next
1️⃣ Does Price Break 776.85?
This is now the immediate bull flag resistance level.
A breakout puts 782.24 directly in sight, followed by 789.84.
2️⃣ Does Price Become Too Extended?
Watch the relationship between price, RSI and the upper Bollinger Band.
If SPY pushes through resistance while becoming increasingly extended, chasing the initial breakout carries considerably more risk.
3️⃣ Does Price Consolidate Back Toward Support?
A controlled pullback would be constructive.
The primary defense structure now sits between:
758.61 and 747.33
with former weekly resistance at 749.53 providing another important structural level inside that area.
A successful retest there could create a much cleaner foundation for the next continuation.
4️⃣ Does Former Weekly Resistance Hold?
This may ultimately be the most important test.
As long as SPY continues holding above the weekly breakout area, the larger move remains intact and the market is increasingly looking toward the ~800 area.
⸻
🎯 Bottom Line
The bulls have taken back control.
The bull flag we’ve been waiting for is now complete:
Pattern Start: 729.10
Low Anchor: 729.10
High Anchor: 776.85
Momentum has confirmed the breakout, weekly resistance has been reclaimed, and SPY is now sitting just beneath both its new bull flag resistance and the first weekly target at 782.24.
But this isn’t necessarily the ideal place to rush into the move.
Price is becoming extended, RSI is approaching overbought territory, and the Bollinger Bands likely need time to widen and catch up with the breakout.
The cleaner path may be:
push higher → test 776.85 / 782.24 → pull back and consolidate → defend the new bullish structure → continuation toward 789.84 and eventually 806.36.
As long as former weekly resistance and the broader bull flag defense structure continue holding, this move is still young.
The market finally gave us the bullish structure we’d been waiting for.
Now patience matters again, this time not because we’re waiting for direction, but because we don’t want to chase a strong move at precisely the point where it may need to cool off.
