
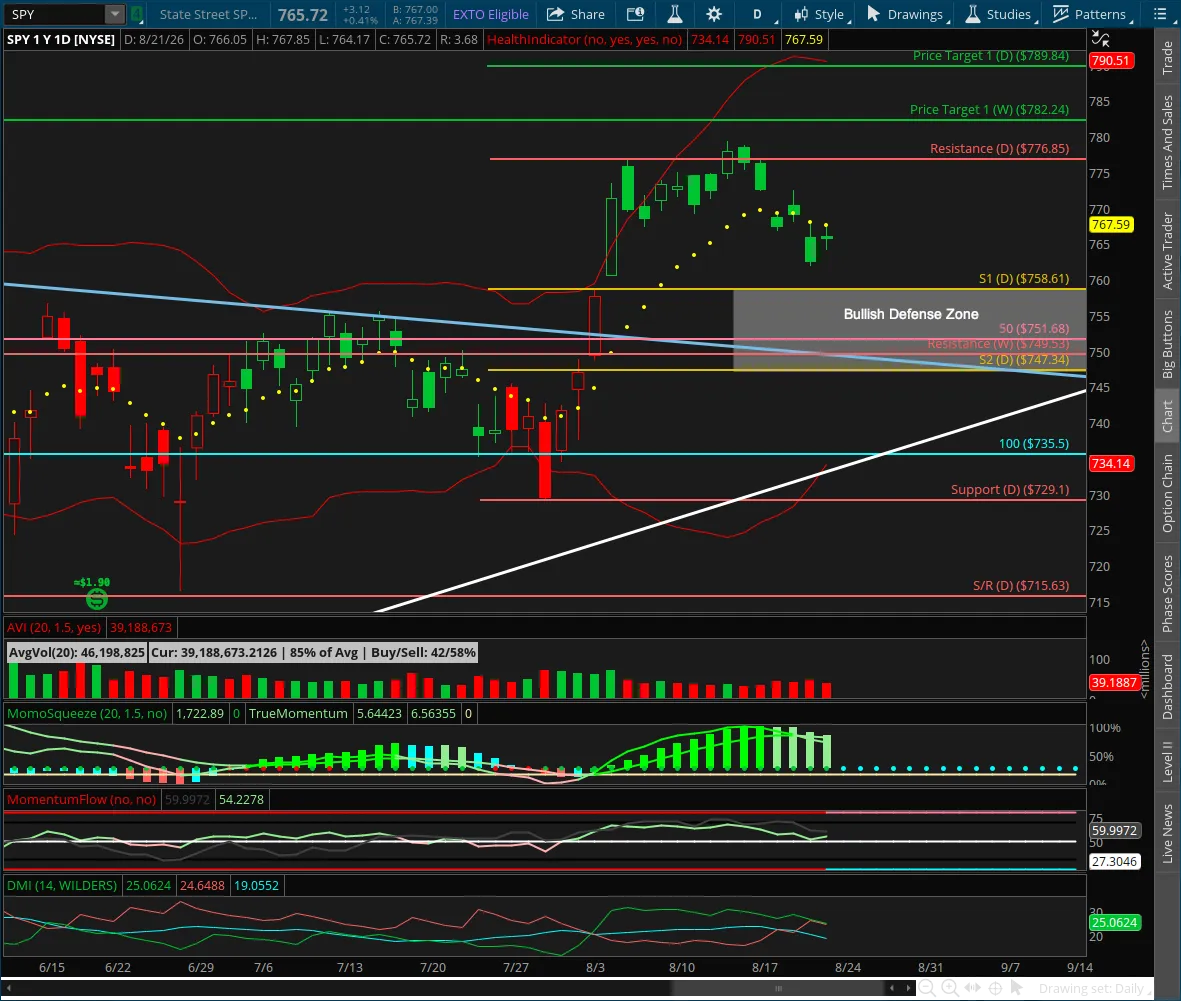
SPY Bull Flag Holds as Breakout Stalls Below Weekly Target

📆 DAILY CHART OUTLOOK — SPY
Week of August 24, 2026
The daily chart is doing almost exactly what we anticipated following the recent breakout.
Two weeks ago, we cautioned that if SPY broke above the newly established bull flag resistance, the initial breakout would likely stall before price could make a clean run toward its upside targets.
That is precisely what happened.
The first breakout attempt stalled beneath the 782.24 weekly target, price lost the daily 10EMA last week, and SPY is now retracing toward the bullish defense zone.
Importantly, none of that has invalidated the larger bull flag.
For now, this remains a healthy bull flag consolidation inside a broader bullish trend.
⸻
📌 Pattern State
Pattern State: Bull Flag Active
Pattern Start: 729.10 (7/29 low)
Low Anchor: 729.10 (7/29 low)
High Anchor: 776.85 (8/5 high)
Active Bull Flag Levels
0% Support: 729.10
38.2% Flag Support: 747.34
61.8% Flag Support: 758.61
100% Resistance: 776.85
Weekly Target: 782.24
127.2% Target 1: 789.84
161.8% Target 2: 806.36
Current Mode: Bull flag consolidation following a failed initial breakout attempt.
Bullish Defense Zone: 747.34–758.61
Structural Invalidation: A close below 747.34 would break the bull flag defense band and materially weaken the current bullish structure.
⸻
🔄 Structural Sequence — What Happened Last Week
1️⃣ Monday — Failed Breakout Continues
Monday opened lower and spent the session pulling back.
That continued the weakness we saw the previous Friday and provided additional confirmation that the initial breakout above 776.85 had failed to generate immediate continuation.
That wasn’t unexpected.
We specifically cautioned before the breakout that price was becoming extended enough that the market would likely need additional consolidation before making a sustainable run toward its larger targets.
⸻
2️⃣ Tuesday — 10EMA Lost
Tuesday provided the more meaningful technical development.
SPY gapped beneath the daily 10EMA and ultimately closed below it.
That paused the breakout continuation and shifted our attention away from chasing upside and toward watching how price behaves during the retracement.
The question became:
Where do buyers step back in?
⸻
3️⃣ Wednesday — Gap Filled, But Buyers Can’t Take Control
Wednesday brought a modest rebound.
Price moved higher and filled the gap created Tuesday, but buyers weren’t able to turn that rebound into a meaningful reversal.
Instead, the bounce stalled and the broader pullback remained intact.
⸻
4️⃣ Thursday — Pullback Continues and MACD Crosses Bearish
Thursday brought another leg lower and an important momentum change.
Daily MACD crossed bearish, confirming that the strength behind the initial breakout had faded.
That doesn’t automatically make the market bearish.
It tells us that the daily timeframe has entered the cooling-off period we had been anticipating.
And that makes the bull flag’s defense structure increasingly important.
⸻
5️⃣ Friday — Inside Bar as Selling Pressure Pauses
Friday printed an inside bar.
After several sessions of selling, price finally compressed rather than extending materially lower.
That leaves SPY entering this week in consolidation with price moving closer to the bullish defense zone.
The next move out of this compression should give us another clue about whether buyers are preparing to defend the flag or whether this consolidation needs more time.
⸻
📐 Immediate Structure Map
The bull flag remains active.
The important levels are now very clearly defined.
Bullish Defense Zone
758.61 — upper flag support
747.34 — lower flag support
Former weekly resistance at 749.53 also sits immediately above the lower portion of this zone, giving bulls another important structural level to defend.
That makes roughly 747–759 the area that matters most if this pullback continues.
As long as price holds this structure, the current move remains a normal retracement within the active bull flag.
Resistance
776.85 — bull flag resistance
Above that:
782.24 — weekly target
789.84 — Daily Target 1
806.36 — Daily Target 2
The first breakout attempt failed.
The next breakout attempt could be considerably more important.
⸻
🔍 Momentum Context
Momentum has cooled, but it hasn’t completely broken down.
The picture entering this week is mixed:
• MACD has crossed bearish
• price has lost the daily 10EMA
• DMI remains in a bullish stance
• TTM Squeeze momentum remains positive
• price remains well above the lower bull flag structure
• the larger weekly trend remains bullish
This is exactly the kind of momentum picture we’d expect during consolidation.
The bulls aren’t currently pressing the trend forward, but they haven’t lost control of the larger structure either.
The TTM Squeeze histogram is especially important now.
Its values remain positive, but momentum is clearly cooling.
If the histogram can stabilize and begin expanding positively again as buyers defend support, that would strengthen the case that the market is preparing for another breakout.
If it rolls through zero and begins producing negative values, expect this consolidation to last longer before the next meaningful upside attempt develops.
⸻
⚠️ Important Structural Note
Don’t confuse a failed breakout attempt with a failed bull flag.
Those are two different things.
The breakout failed.
The bull flag has not.
Price can retrace considerably from here and still remain inside the structure established by the 729.10 → 776.85 flag.
That is why the defense zone matters.
As long as SPY continues holding above 747.34, the current pullback should be treated primarily as consolidation within the active bullish pattern.
A close beneath that level would materially change the picture.
⸻
🧭 What Happens Next
There are three things I’m watching this week.
1️⃣ Does Price Hold the Bullish Defense Zone?
This is the immediate question.
SPY is moving toward 758.61–747.34, and that is where we should increasingly expect buyers to show themselves.
A successful defense followed by improving daily momentum would create a much healthier foundation for the next breakout attempt.
2️⃣ Does TTM Squeeze Momentum Remain Positive?
The histogram is cooling.
If it remains positive through this retracement and begins expanding again, that would be constructive.
If it crosses negative, the market is probably telling us that the consolidation needs more time.
3️⃣ Can SPY Eventually Retake 776.85?
That’s the level that puts continuation back in play.
The first attempt failed.
After this consolidation finishes, another sustained break above 776.85 would put 782.24 immediately back in sight, followed by 789.84 and eventually 806.36.
That is the move that could finally carry SPY toward and through the 800 area.
⸻
🎯 Trading Plan
This is not an environment where we need to guess when the pullback ends.
Let the market show us.
The active bull flag remains intact, the larger weekly trend remains bullish, and price is now doing the consolidation work we expected after the initial breakout attempt stalled.
If buyers defend the 758.61–747.34 zone and momentum begins improving, we’ll have a much cleaner setup for another attempt higher.
If 747.34 fails on a closing basis, we’ll reassess the bullish structure rather than blindly assuming another breakout is coming.
Until then, intraday price action leads the way.
ORBI setups remain particularly useful while the daily chart works through this consolidation because they allow us to follow the direction actually being rewarded inside the day rather than trying to predict when the larger swing move begins.
⸻
🎯 Bottom Line
The first bull flag breakout attempt failed exactly where we expected the market could begin running out of room.
Now SPY is cooling off.
But the underlying bullish structure remains intact.
Going into this week:
• Bull Flag Active
• Low Anchor: 729.10
• High Anchor: 776.85
• Bullish Defense Zone: 758.61–747.34
• Weekly Target: 782.24
• Daily Target 1: 789.84
• Daily Target 2: 806.36
• MACD has crossed bearish
• DMI remains bullish
• TTM Squeeze remains positive but is cooling
As long as 747.34 holds, this is still a healthy bull flag consolidation.
The market may need a little more time before it’s ready.
But if buyers successfully defend this structure, the next breakout attempt is increasingly likely to be the one capable of carrying SPY toward the 800 area.
