
SPY Bull Flag Holds as Major Resistance Comes Into Focus
📆 DAILY CHART OUTLOOK — SPY
Week of October 5, 2026
Last week gave us a useful reminder about which structure deserves the most weight in this market.
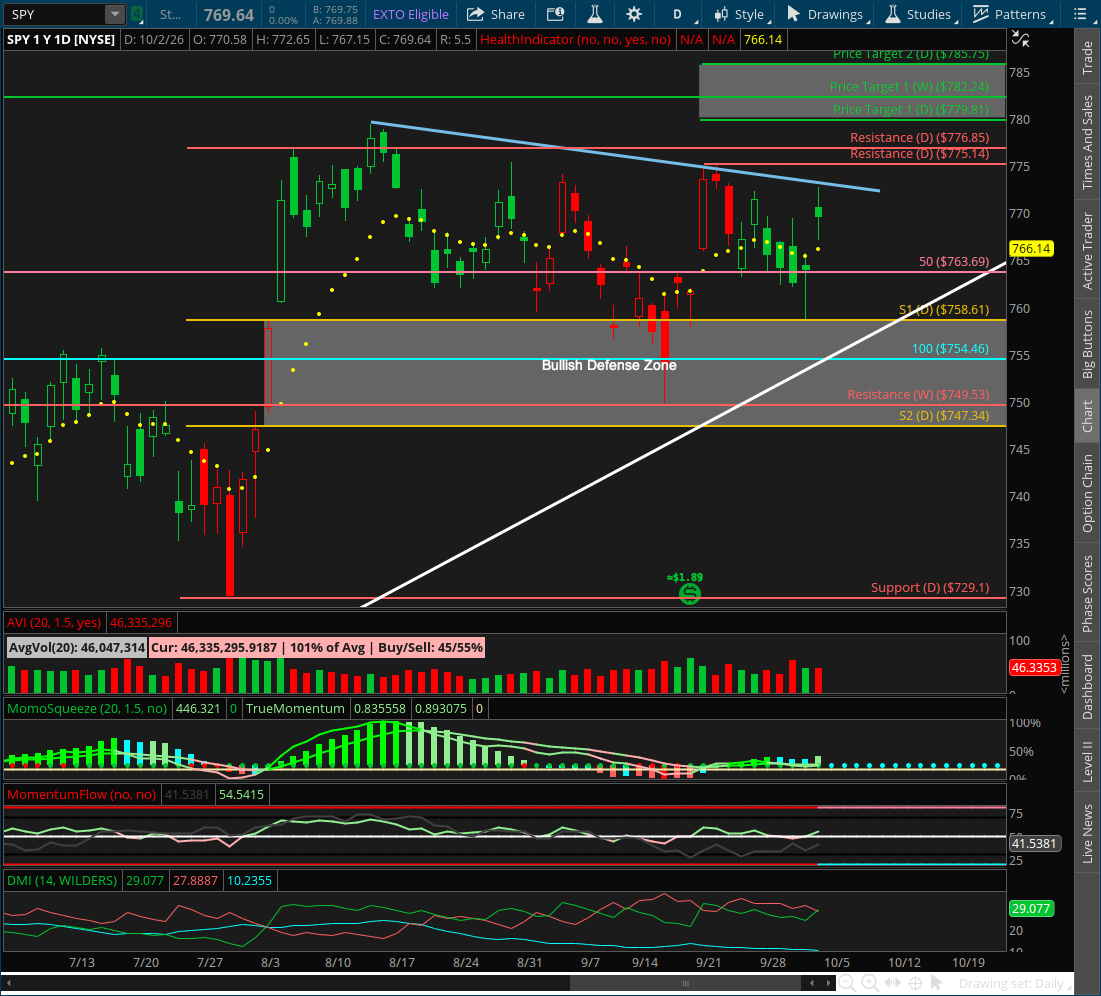
Going into the week, I was monitoring a smaller bull flag developing inside the much larger daily pattern we've been following since late July. That minor pattern never confirmed its breakout and was invalidated Tuesday. By the time the opposite bearish structure formed, that pattern was invalidated almost immediately as well. Pasted text
That doesn't mean those smaller patterns were useless.
They helped define the shorter-term battle between buyers and sellers, and several of the levels they established remain technically relevant.
But after watching multiple minor patterns form and fail during this extended consolidation, I'm going to stop trying to map every smaller pattern that appears inside the range.
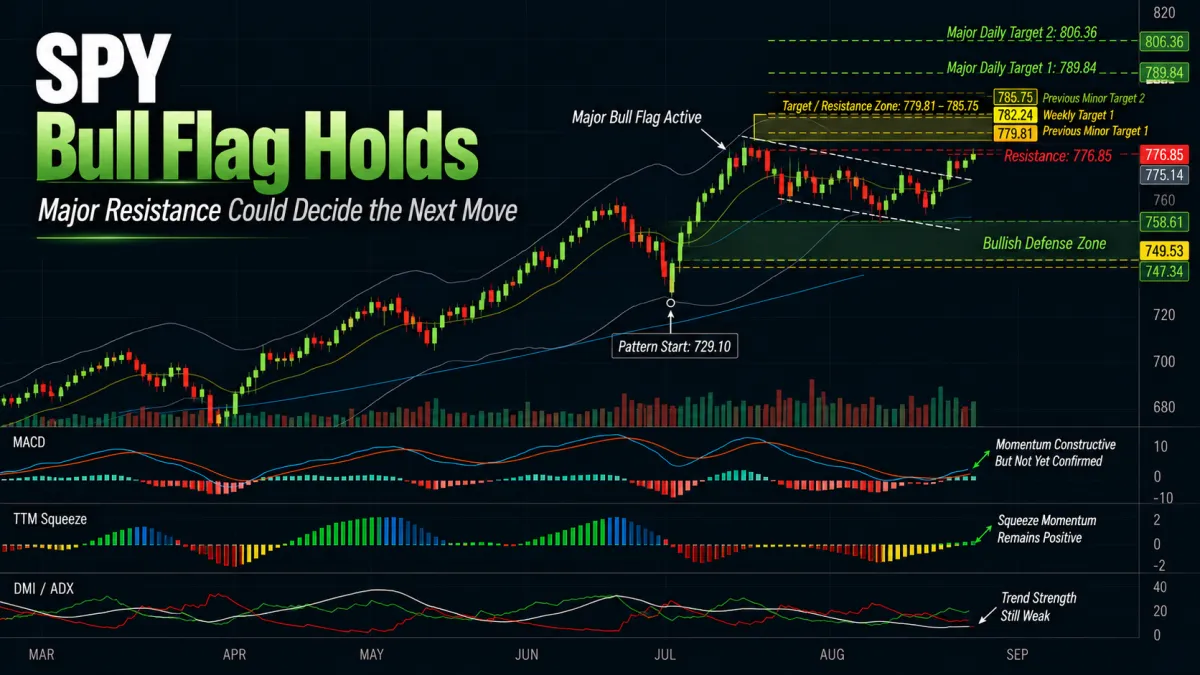
The primary structure remains the major daily bull flag we've been following for months.
That is where I'm refocusing the analysis this week.
⸻
📌 Pattern State
Pattern State: Bull Flag Active
Pattern Start: 729.10 (7/29 low)
Low Anchor: 729.10 (7/29 low)
High Anchor: 776.85 (8/5 high)
Active Bull Flag Levels
0% Support: 729.10
38.2% Flag Support: 747.34
61.8% Flag Support: 758.61
100% Resistance: 776.85
127.2% Target 1: 789.84
161.8% Target 2: 806.36
Pattern Confirmation: Bull flag established on 8/6.
Current Mode: Major bull flag remains active while price continues consolidating beneath resistance. The shorter-term patterns that developed inside the range failed last week and are no longer guiding the daily outlook.
Bullish Defense Zone: 747.34–758.61
Structural Invalidation: A daily close below 747.34 would materially damage the active bull flag structure and signal that bulls are losing control of the current consolidation. Pasted text
⸻
🔄 Structural Sequence — What Happened Last Week
1️⃣ Monday — Selling Returns
Monday opened lower and sellers controlled the session.
Price moved back toward support while the smaller bull flag we were monitoring remained under pressure.
There still wasn't enough directional strength to suggest the broader consolidation had resolved.
⸻
2️⃣ Tuesday — Minor Bull Flag Invalidated
Tuesday opened inside Monday's candle body, filling the nearby order imbalance before sellers took over again.
Price ultimately closed below the support structure of the minor bull flag.
That invalidated the shorter-term bullish pattern before its breakout had ever confirmed.
That distinction matters.
We weren't trading the minor pattern simply because it existed. We were waiting for price to confirm a breakout above its resistance before treating it as an actionable continuation structure.
That confirmation never came.
Instead, the market moved back into chop inside the much larger daily bull flag.
⸻
3️⃣ Wednesday — Morning Strength Fades
Wednesday opened higher and initially rallied.
But buyers couldn't sustain the move.
Price reversed during the afternoon and sold off harder into the close, continuing the back-and-forth behavior we've seen throughout this extended consolidation.
That weakness began creating the opposite bearish short-term structure.
⸻
4️⃣ Thursday — Bearish Structure Fails Too
Thursday opened back inside Wednesday's body and filled another apparent imbalance.
Price initially sold off again before reversing sharply and rallying through the afternoon.
That recovery invalidated the developing bearish structure almost as quickly as it formed.
And that's really the important takeaway from the week:
the smaller patterns inside this consolidation simply aren't being respected for very long.
The major bull flag, meanwhile, continues to hold.
⸻
5️⃣ Friday — Two-Way Battle Into the Close
Friday gapped higher and initially tried to extend the move.
Sellers stepped in, pushed price lower, and then buyers returned during the afternoon to recover most of the weakness.
The resulting candle left long wicks on both sides of the body.
That tells us buyers and sellers are still actively battling around current prices.
It also gives us a useful intraday roadmap for the beginning of this week.
An early break of Friday's high or Friday's low could provide the first directional clue, particularly if that move is confirmed by alignment across the lower and higher timeframes.
⸻
📐 Immediate Structure Map
The major bull flag once again becomes the cleanest structure to follow.
Major Daily Resistance
776.85
This remains the level that ultimately needs to break before we can say the major bull flag has entered continuation.
But there's another important resistance immediately beneath it.
Previous Minor Resistance: 775.14
The minor bull flag itself failed.
That does not mean every level it established disappears.
775.14 remains a useful known resistance level.
A break above it would tell us two things:
the short-term daily downtrend is failing again
price is reclaiming a level that previously rejected buyers
From there, the real confirmation becomes a daily close above 776.85.
⸻
🎯 The 779.81–785.75 Resistance Zone
If SPY clears both 775.14 and 776.85, I'm still watching the upside levels created by the previous minor structure:
779.81 — Previous Minor Target 1
782.24 — Weekly Target 1
785.75 — Previous Minor Target 2
Together, those levels create a very clear 779.81–785.75 resistance and profit-taking zone immediately above the major bull flag breakout. Pasted text
And I don't expect SPY to simply blow through that entire area without a fight.
The 782.24 weekly target has been sitting overhead for months.
So if the major bull flag finally breaks above 776.85, one scenario I'm specifically prepared for is:
776.85 breakout → 779.81–785.75 target test → rejection / failed breakout → additional consolidation → final continuation higher
That would still fit the larger bullish roadmap.
In fact, given how long this market has already spent consolidating and how little trend strength ADX currently shows on both the daily and weekly charts, a rejection from that target cluster followed by another period of consolidation would make a lot of sense.
That could be the reset the market needs before making the final leg higher.
⸻
⚠️ Where the Monthly Divergence Thesis Fits
This is also the area where the monthly analysis becomes especially important.
We've now had roughly seven months with monthly RSI in overbought territory, and price has continued making higher highs without RSI yet exceeding its January high.
If SPY pushes into this 779.81–785.75 zone and ultimately makes another significant price high while monthly RSI fails to confirm with a higher momentum high, the bearish-divergence thesis we've been discussing would begin taking clearer shape.
My expectation in that scenario isn't necessarily that the bull market ends immediately.
I could easily see something more drawn out:
new highs → momentum divergence → rejection / cooling period → another rally attempt → eventual larger correction if momentum fails again
That process could take months.
So the target zone immediately ahead isn't just important for the current daily trade.
It may also become the first area where the longer-term roadmap starts revealing itself.
⸻
🎯 Major Daily and Monthly Targets
If buyers can eventually work through the 779.81–785.75 resistance cluster:
789.84 — Major Daily Target 1
806.36 — Major Daily Target 2
And beyond that:
818.18 — Monthly Target 2
The market still has room to get there.
My question isn't whether those targets remain technically possible.
They do.
The question is whether current momentum is strong enough to carry SPY through the first resistance cluster now, or whether the market needs one more consolidation first.
⸻
🔍 Momentum Context
This remains the issue.
The structure is bullish.
The momentum isn't convincing yet.
MACD
MACD remains uncrossed.
A bullish cross would materially improve the outlook and give us more confidence that buyers finally have enough momentum to push beyond resistance.
If SPY clears 776.85 while MACD crosses bullish, I'd become considerably more confident that the market has enough energy to begin working through the next target sequence.
And if momentum becomes strong enough to carry SPY cleanly through the 779.81–785.75 zone, then the larger daily and monthly targets become much more realistic without another major reset first.
⸻
ADX
ADX remains extremely low on both the daily and weekly charts.
That's the biggest reason I'm not yet convinced the market is ready for a sustained breakout.
Low ADX is consistent with exactly what we've been experiencing:
chop
failed short-term patterns
weak follow-through
repeated reversals around nearby support and resistance
We need trend strength to return.
A breakout without improving ADX would be much easier to distrust.
And that is precisely why a move into 779.81–785.75 could still fail even after the major bull flag technically breaks.
⸻
DMI
DMI remains constructive, but the directional spread isn't especially convincing.
Again, the message is the same:
bulls still control the larger structure, but they haven't demonstrated overwhelming directional strength.
If DI+ begins expanding away from DI- while ADX turns higher, that would materially improve the quality of any breakout attempt.
⸻
TTM Squeeze
The Squeeze histogram remains positive.
That's constructive.
But the broader compression environment still hasn't translated into sustained trend expansion.
So while the underlying setup remains bullish, the market still hasn't given us the kind of momentum confirmation that would justify assuming a clean run through every target.
⸻
⚠️ Refocusing on the Major Pattern
Last week's price action gave us a useful reminder about how much weight to place on the smaller structures developing inside this consolidation.
The minor bull flag we were monitoring never confirmed its breakout and was invalidated Tuesday.
The opposite bearish structure that developed afterward was then invalidated almost immediately as well. Pasted text
That doesn't mean those patterns were useless.
They helped define the shorter-term battle between buyers and sellers, and several of the levels they established remain valuable reference points.
But after watching multiple minor patterns form and fail during this extended consolidation, I'm going to stop trying to map every smaller pattern that appears inside the range.
The more important structure remains the major daily bull flag we've been following for months:
729.10 → 776.85
That is the pattern I'm refocusing the daily analysis around.
The previous minor bull flag's targets still matter:
779.81 — Previous Minor Target 1
782.24 — Weekly Target 1
785.75 — Previous Minor Target 2
Together, those levels create the resistance zone I expect the market to battle if the major flag finally breaks.
We could see profit-taking there.
We could see the weekly target reject price.
And we could even see the breakout above 776.85 fail, sending SPY back into another period of consolidation before the final leg higher develops.
That would not automatically invalidate the larger bullish thesis.
It may simply mean this market still needs more time before it has enough momentum to finish the move.
So the hierarchy going forward is simple:
Major daily bull flag = primary pattern and structural roadmap.
Previous minor-pattern levels = useful reference points where they remain technically relevant.
New minor patterns = worth emphasizing only when they become persistent enough to materially improve the roadmap.
⸻
🧭 What Happens Next
1️⃣ Does 747.34 Continue Holding?
This remains the most important structural requirement.
As long as SPY remains above 747.34, the major daily bull flag remains intact and bulls retain control.
A daily close below that level changes the outlook materially.
⸻
2️⃣ Can SPY Break 775.14?
This is the first near-term clue.
Reclaiming the old minor resistance would suggest the short-term downtrend is beginning to fail again.
But that level alone isn't enough.
⸻
3️⃣ Can SPY Close Above 776.85?
This is the actual major pattern breakout.
A sustained close above 776.85 puts:
779.81 → 782.24 → 785.75
directly into play.
But that target cluster should be treated as the next test, not automatically as an area price will slice straight through.
⸻
4️⃣ How Does Price Behave at 779.81–785.75?
This may become the most important question if the breakout occurs.
Does price:
push through with momentum?
stall and consolidate?
reject at the weekly target?
produce another failed breakout?
A rejection there followed by more consolidation would still fit my expectation for a final continuation higher later.
⸻
5️⃣ Does MACD Confirm?
This is where breakout quality matters.
A resistance break accompanied by a bullish MACD cross would give us considerably more confidence that trend momentum is returning.
Without it, I'd remain cautious about chasing.
⸻
6️⃣ Does ADX Finally Rise?
This remains the missing ingredient on both the daily and weekly charts.
If price breaks resistance while ADX begins rising, the case for genuine expansion becomes much stronger.
If ADX stays pinned near current lows, expect more chop even if SPY temporarily breaks resistance.
⸻
🎯 Intraday Trading Plan
Friday's candle gives us a useful roadmap for the beginning of the week.
The long upper and lower wicks demonstrate that both buyers and sellers were active.
That makes Friday's high and low useful short-term reference points.
An early break through either side could trigger continuation in that direction.
Rather than blindly trading SPY itself, the stronger opportunity may be to identify the names with the most timeframe alignment in the direction of that break.
That's where ORBI becomes particularly useful.
If SPY breaks Friday's high:
focus on names with bullish 15-minute, 30-minute, 1-hour and higher-timeframe alignment.
If SPY breaks Friday's low:
focus on names with the strongest bearish timeframe alignment.
Let the index tell us direction.
Then trade the names best positioned to take advantage of that momentum.
⸻
🎯 Bottom Line
We're refocusing on the major daily bull flag:
Pattern State: Bull Flag Active
Pattern Start: 729.10
Low Anchor: 729.10
High Anchor: 776.85
Bullish Defense Zone: 747.34–758.61
Major Resistance: 776.85
Major Target 1: 789.84
Major Target 2: 806.36
The previous minor bull flag never confirmed its breakout and was invalidated.
The bearish pattern that followed failed too.
That tells me the shorter-term market remains choppy and that the larger structure is currently the more useful guide.
But the old minor levels still matter.
775.14 remains the first resistance clue.
A close above 776.85 would confirm the major bull flag breakout and put the 779.81–785.75 target/resistance cluster directly into focus.
And that zone may prove much more important than simply giving us a place to take profits.
It's where we could see the weekly target reject price, where a breakout could fail, and where another consolidation could begin before the final leg higher.
If price instead powers through that area, MACD crosses bullish, and ADX finally begins rising, the market may still have enough momentum to continue toward:
789.84 → 806.36 → 818.18
At the same time, that move into new highs is where I'll be watching the monthly RSI picture very closely.
If price continues higher without RSI confirming, the longer-term bearish-divergence thesis begins gaining credibility.
For now, though, the bulls still control the structure.
They just haven't proven they have enough strength to finish the move in one shot.
