
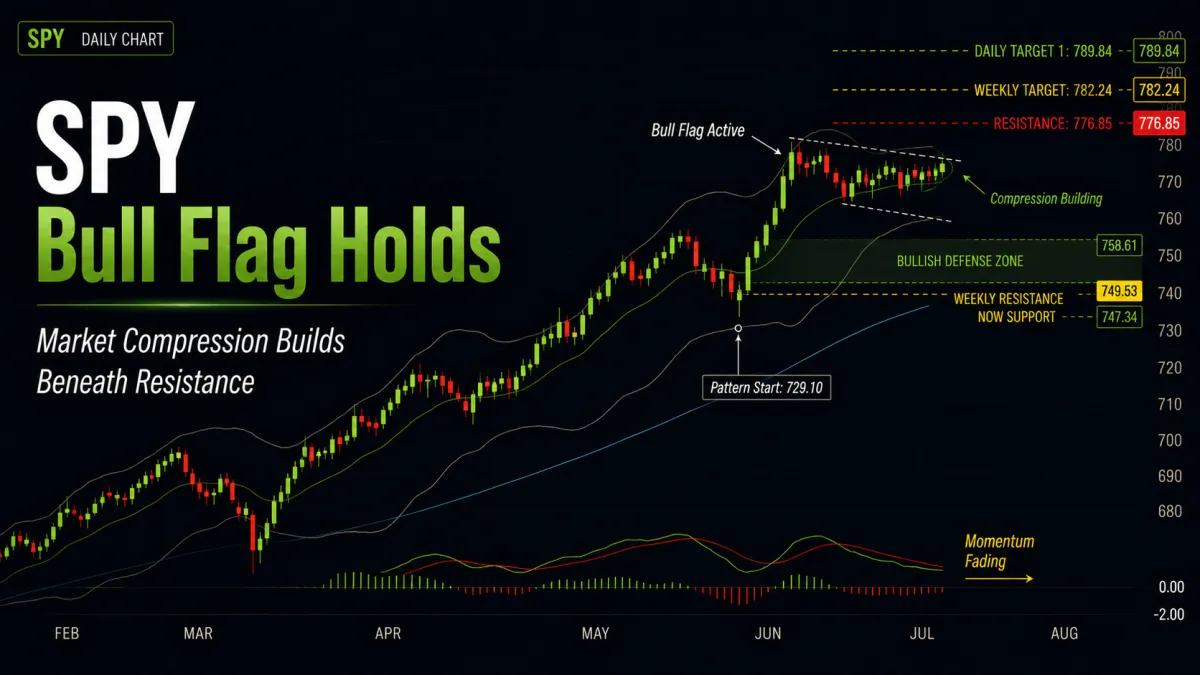
SPY Bull Flag Holds as Market Compression Builds
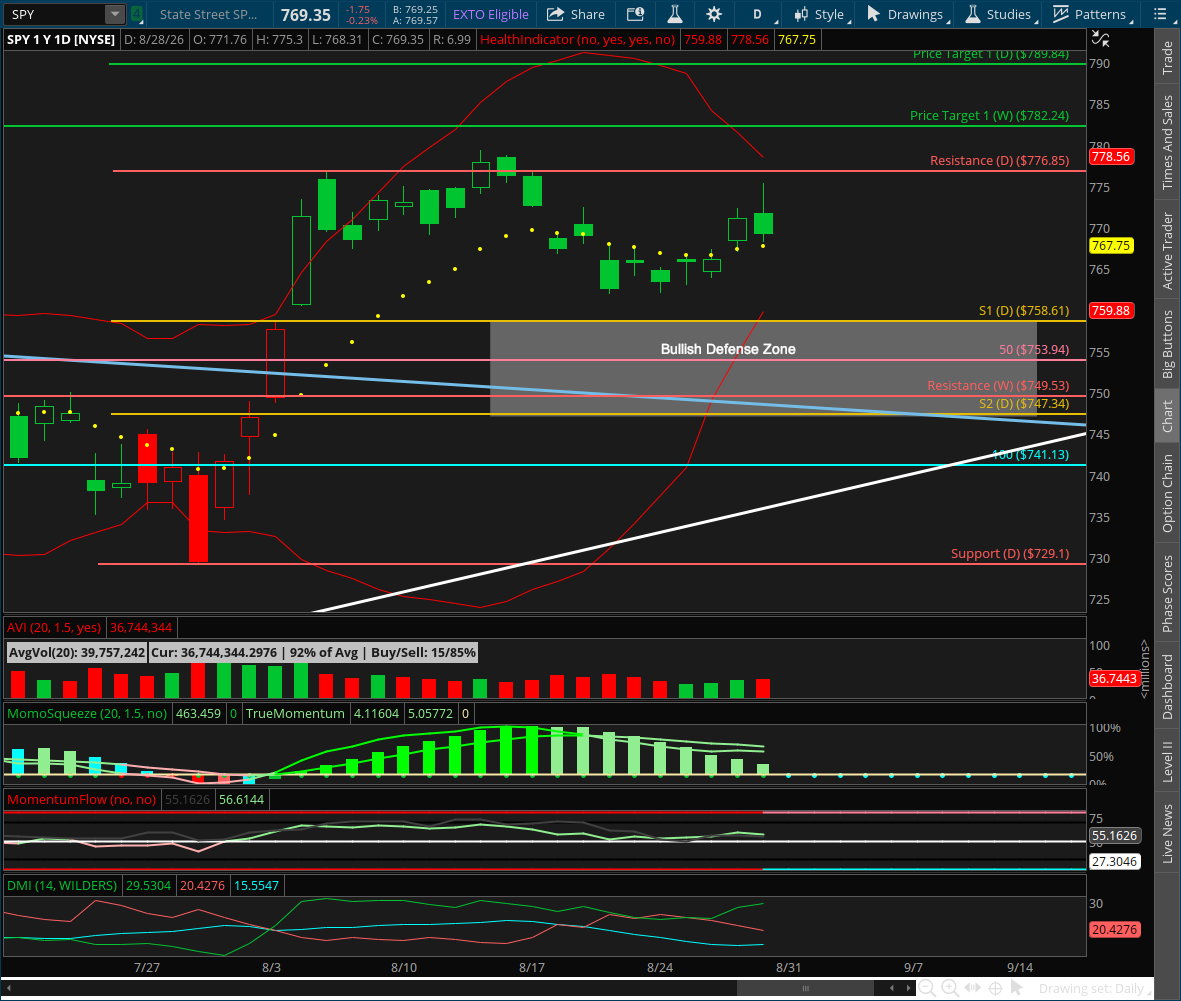
📆 DAILY CHART OUTLOOK — SPY
Week of August 31, 2026
The daily chart remains in consolidation, and the same bull flag we’ve been tracking remains active.
Two weeks ago, SPY’s first breakout attempt above 776.85 failed exactly where we had warned the market was becoming too extended to comfortably chase. Since then, price has spent roughly two weeks moving sideways beneath resistance while the Bollinger Bands contract and momentum cools.
That’s constructive.
The market appears to be building toward another volatility expansion, but the TTM Squeeze has not officially fired yet.
For now, the bull flag remains intact and the roadmap hasn’t materially changed:
buyers remain in control above the defense zone, but the market may benefit from one more pullback before it’s ready to make a sustainable run through resistance.
⸻
📌 Pattern State
Pattern State: Bull Flag Active
Pattern Start: 729.10 (7/29 low)
Low Anchor: 729.10 (7/29 low)
High Anchor: 776.85 (8/5 high)
Active Bull Flag Levels
0% Support: 729.10
38.2% Flag Support: 747.34
61.8% Flag Support: 758.61
100% Resistance: 776.85
Weekly Target: 782.24
127.2% Target 1: 789.84
161.8% Target 2: 806.36
Current Mode: Bull flag consolidation following the failed initial breakout attempt. Volatility continues compressing beneath resistance.
Bullish Defense Zone: 747.34–758.61
Structural Invalidation: A close below 747.34 would break the bull flag defense structure, lose the key weekly breakout area, and materially weaken the current bullish pattern.
⸻
🔄 Structural Sequence — What Happened Last Week
1️⃣ Monday — Consolidation Continues
Monday continued the sideways behavior that developed after the failed breakout.
Rather than extending the previous week’s pullback toward the bullish defense zone, SPY stabilized above support and remained inside the broader consolidation.
That kept the active bull flag intact.
⸻
2️⃣ Tuesday — Buyers Hold the Range
Tuesday produced another relatively contained session.
Price continued building above the recent lows without generating the kind of momentum necessary to challenge 776.85.
This remained consolidation rather than meaningful directional expansion.
⸻
3️⃣ Wednesday — Buyers Begin Pressing Higher
By Wednesday, buyers began pushing SPY back toward the upper portion of the recent range.
The move was constructive, but declining trend strength remained an important consideration.
With ADX continuing to fade, we still weren’t seeing evidence of the kind of directional strength we’d want behind a sustainable breakout.
⸻
4️⃣ Thursday — Resistance Comes Back Into View
Thursday pushed price closer to bull flag resistance as buyers continued the rebound from the prior week’s lows.
That put 776.85 back within striking distance.
But the technical backdrop remained one of compression rather than expansion.
That distinction matters.
Another test of resistance without renewed momentum could simply produce another rejection.
⸻
5️⃣ Friday — Price Stalls Beneath Resistance
Friday pushed as high as 775.30 before closing at 769.35, leaving SPY beneath the 776.85 bull flag resistance heading into this week.
The result is a market that has recovered from its recent pullback but still hasn’t demonstrated enough strength to complete the next breakout.
At the same time, the Bollinger Bands have continued contracting around price.
The setup is tightening.
⸻
📐 Immediate Structure Map
The active bull flag remains clearly defined.
Bull Flag Resistance
776.85
This is still the level buyers need to reclaim and hold before another continuation attempt begins.
Immediately above it sits:
782.24 — Weekly Target
Followed by:
789.84 — Daily Target 1
806.36 — Daily Target 2
Bullish Defense Zone
758.61 — Upper Flag Support
747.34 — Lower Flag Support
Former weekly resistance at 749.53 remains directly inside the lower portion of this structure.
That creates a particularly important cluster around 747–759.
And right now, that zone is becoming increasingly interesting.
⸻
🔍 Momentum Context
The studies remain bullish overall, but trend strength continues to fade.
DMI remains bullish
MACD remains constructive
TTM Squeeze momentum remains positive
ADX continues declining
Bollinger Bands are contracting tightly around price
The TTM Squeeze histogram is fading toward zero
That’s the textbook picture of a market losing directional momentum while volatility compresses.
But importantly:
the TTM Squeeze has not officially triggered yet.
We’re seeing the conditions develop, but we’re not going to front-run the signal.
If compression continues, a squeeze could develop and eventually provide the energy for the next directional move.
Until then, price remains trapped between resistance overhead and an attractive bullish defense structure underneath.
⸻
⚠️ Why a Pullback Could Actually Help
Another immediate attempt at 776.85 isn’t necessarily the ideal bullish scenario.
Price has recovered toward resistance, but ADX remains weak and the market hasn’t rebuilt meaningful directional strength.
That leaves another rejection possible.
A controlled pullback toward the 758.61–747.34 bullish defense zone could actually improve the setup considerably.
The lower Bollinger Band has now curled higher and sits above that zone.
A pullback toward defense could therefore:
push price back toward an attractive structural support area
allow the Bollinger Bands to begin widening again
create better long entry prices
give buyers an opportunity to demonstrate support
provide the foundation for renewed momentum after the bounce
In other words, weakness from here wouldn’t automatically be bad news.
It could create the setup we’re waiting for.
⸻
🧭 What Happens Next
1️⃣ Does SPY Break 776.85 Immediately?
It’s possible.
The market also has fresh energy-market developments to digest as the new week begins, which could produce a sharper-than-normal reaction.
But we don’t need to predict that reaction.
If buyers push through 776.85 with renewed momentum, then 782.24 becomes the immediate test, followed by 789.84.
What matters isn’t simply trading above resistance.
We already saw that once.
We need follow-through.
2️⃣ Does Price Pull Back Toward the Defense Zone?
This may actually produce the cleaner setup.
The 758.61–747.34 zone remains the primary area where we’d expect buyers to defend the active bull flag.
A pullback there followed by renewed buying pressure could create a substantially better foundation for the next breakout attempt.
3️⃣ Does the TTM Squeeze Histogram Cross Below Zero?
This is one of the most important momentum tells this week.
The histogram remains positive but continues fading.
If it rolls negative, expect a longer consolidation before the eventual upside move develops.
If it stabilizes and begins expanding positively again, that would suggest buyers are rebuilding momentum sooner.
4️⃣ Does 747.34 Hold?
This remains the line that matters.
As long as SPY holds above 747.34, the active bull flag remains structurally healthy.
A close below that level would change the picture materially.
Not only would the bull flag lose its defense structure, but price would also be breaking back through the key weekly breakout area.
At that point, a deeper pullback toward the longer-term rising trendline would quickly come into play.
⸻
🎯 Trading Plan
This remains a patience pays environment.
The market is compressing, the Bollinger Bands are tightening, trend strength is weak, and SPY remains trapped beneath the same resistance that rejected the previous breakout.
There is little reason to guess which direction resolves first.
If SPY breaks 776.85 with strength and follow-through, we can follow the move toward 782.24 and 789.84.
If price pulls back instead, the 758.61–747.34 bullish defense zone may provide the more attractive opportunity.
And if 747.34 fails, we stop treating the weakness as routine bull flag consolidation and reassess the larger structure.
Until one of those things happens, intraday price action leads the way.
⸻
🎯 Bottom Line
The bull flag remains active.
Pattern Start: 729.10
Low Anchor: 729.10
High Anchor: 776.85
Bullish Defense Zone: 758.61–747.34
Bull Flag Resistance: 776.85
Weekly Target: 782.24
Daily Target 1: 789.84
Daily Target 2: 806.36
Markets have now spent roughly two weeks consolidating after the first breakout attempt failed.
The Bollinger Bands are curling tightly around price, ADX continues fading, and the TTM Squeeze histogram is approaching zero.
The market is compressing, but the squeeze hasn’t officially arrived yet.
A pullback into the bullish defense zone could create the room and buying opportunity needed to finally build enough momentum for a sustainable breakout.
As long as 747.34 holds, bulls remain in control of the pattern.
Lose that level, and the roadmap changes.
Until then, patience remains the trade.
