
SPY Bull Flag Holds as Momentum Begins to Rebuild
📆 DAILY CHART OUTLOOK — SPY
Week of September 7, 2026
Last week's price action gave us almost exactly the pullback we were looking for.
Going into the week, SPY had spent several sessions compressing beneath 776.85 resistance while trend strength continued fading. We noted that another immediate attempt at resistance without first creating some room underneath price could easily result in another rejection.
Instead, the market pulled back.
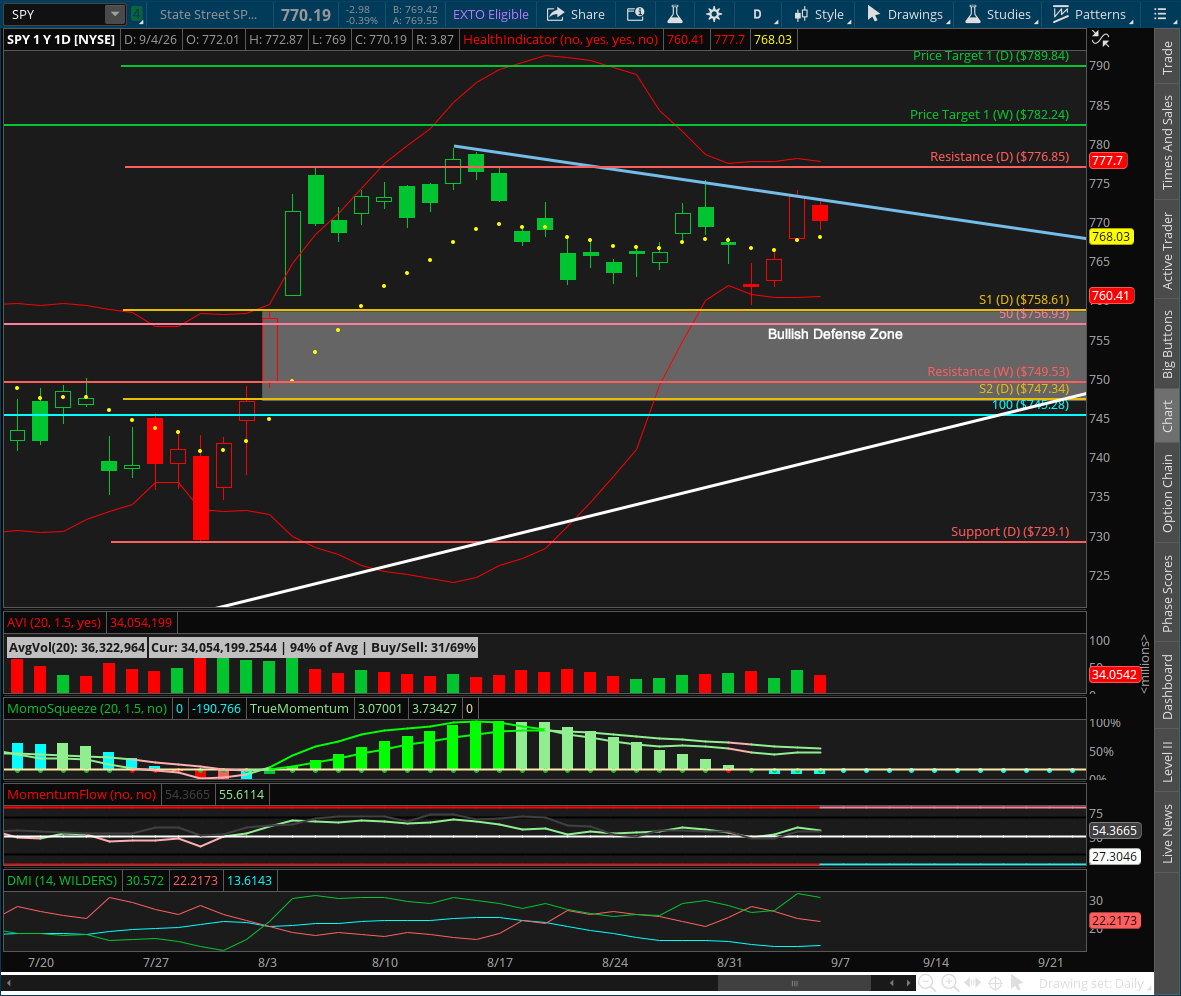
SPY moved toward the bullish defense structure, briefly traded beneath the lower Bollinger Band, found buyers just above the defense zone, and then began pushing higher again into the end of the week.
That's constructive.
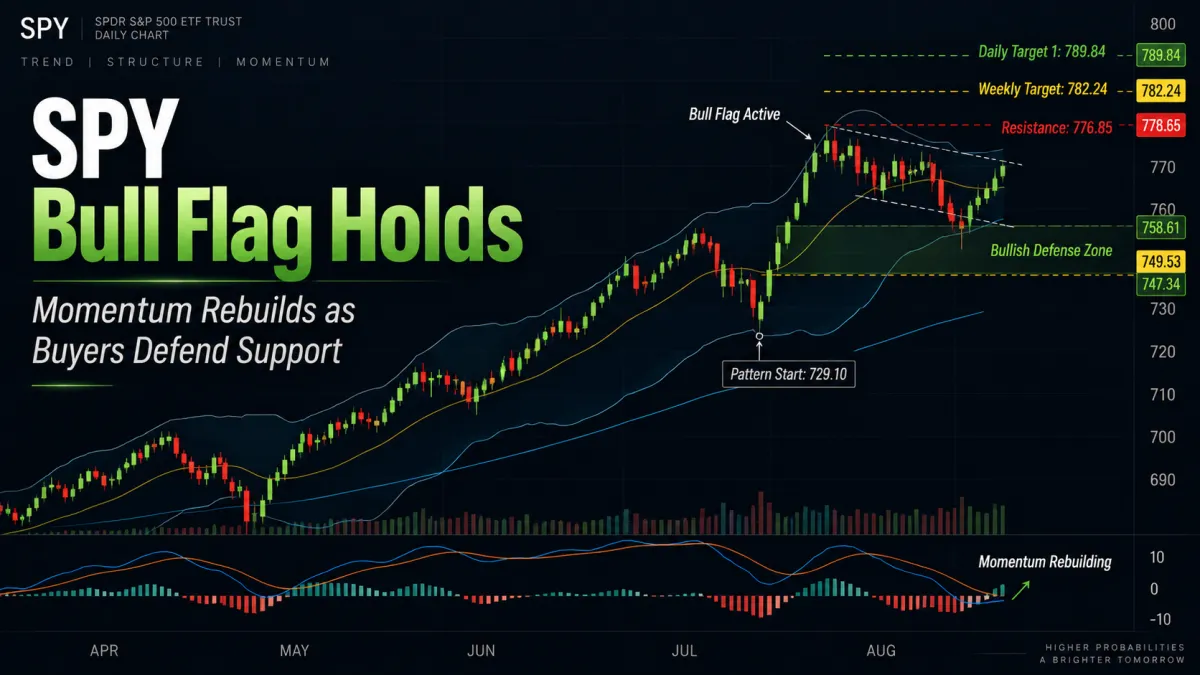
The same daily bull flag remains active, and the market may now be attempting to rebuild the momentum needed for another breakout attempt.
But we're not there yet.
⸻
📌 Pattern State
Pattern State: Bull Flag Active
Pattern Start: 729.10 (7/29 low)
Low Anchor: 729.10 (7/29 low)
High Anchor: 776.85 (8/5 high)
Active Bull Flag Levels
0% Support: 729.10
38.2% Flag Support: 747.34
61.8% Flag Support: 758.61
100% Resistance: 776.85
Weekly Target: 782.24
127.2% Target 1: 789.84
161.8% Target 2: 806.36
Current Mode: Bull flag consolidation with buyers responding after price pulled back toward the bullish defense zone.
Bullish Defense Zone: 747.34–758.61
Structural Invalidation: A close below 747.34 would break the bull flag defense structure, lose the key weekly breakout area, and materially weaken the current bullish pattern.
⸻
🔄 Structural Sequence — What Happened Last Week
1️⃣ Monday — Pullback Begins
SPY opened the week under pressure and began moving lower.
That was not an unwelcome development.
After several weeks of sideways consolidation beneath resistance, the market needed either renewed momentum or a pullback capable of creating more room for buyers.
Price chose the second path.
⸻
2️⃣ Tuesday — Buyers Tested Near Support
Selling continued toward the lower Bollinger Band and the bullish defense structure underneath price.
This was the area we'd specifically identified as potentially attractive if SPY pulled back before making another breakout attempt.
Rather than collapsing through support, buyers began responding.
⸻
3️⃣ Wednesday — Rebound Begins
Price stabilized and began working higher from the recent lows.
The important point wasn't simply that SPY bounced.
It was where the bounce developed.
Buyers stepped in after price stretched beneath the Bollinger Bands but before the primary bullish defense structure was broken.
That kept the active bull flag healthy.
⸻
4️⃣ Thursday — Bulls Push Back Toward Resistance
Thursday produced the strongest upside response of the week.
SPY pushed sharply higher, putting the upper portion of the recent range back into play and moving price toward the descending short-term resistance structure.
Momentum also began showing early signs of improvement.
That is exactly what we'd want to see after a successful defense of support.
⸻
5️⃣ Friday — Consolidation Beneath Resistance
Friday failed to immediately extend Thursday's move.
SPY closed at 770.19, leaving price beneath the 776.85 bull flag resistance but well above the lows established earlier in the week.
That leaves us entering the shortened Labor Day week with buyers having successfully defended the pullback—but without a confirmed breakout yet.
⸻
📐 Immediate Structure Map
The roadmap remains extremely clean.
Bull Flag Resistance
776.85
This remains the primary level bulls need to reclaim and hold.
Immediately above it:
782.24 — Weekly Target 1
Then:
789.84 — Daily Target 1
806.36 — Daily Target 2
A sustained breakout through 776.85 with improving momentum would put those objectives directly back into play.
Bullish Defense Zone
758.61 — Upper Flag Support
747.34 — Lower Flag Support
Former weekly resistance at 749.53 continues to reinforce the lower portion of this zone.
Last week's pullback stopped just above this structure.
That's exactly the kind of response bulls needed.
⸻
🔍 Momentum Context
This is where things become interesting.
DMI
DMI remains bullish.
DI+ remains above DI-, and buyers continue controlling the directional structure.
ADX
ADX remains relatively low, but it has finally started turning higher.
That's worth watching.
We've spent several weeks discussing how declining ADX reflected the market's loss of trend strength during consolidation.
If ADX continues rising alongside bullish price action, that would suggest directional momentum is beginning to return.
TTM Squeeze
The TTM Squeeze histogram has now crossed slightly negative.
That's technically a deterioration from the prior positive readings.
But the current negative values are considerably shallower than the previous negative momentum cycle.
That raises the possibility of momentum divergence developing underneath price.
It isn't confirmation yet.
What we really want to see now is the histogram reverse back through zero and begin expanding positively.
That would be a very constructive sign.
MACD
MACD has not yet produced the bullish cross we're waiting for.
That remains another missing piece.
If the Squeeze turns positive while MACD crosses bullish and ADX continues rising, the technical case for another breakout attempt would strengthen considerably.
⸻
⚠️ Don't Put the Cart Before the Horse
The bullish setup looks increasingly attractive.
But that doesn't mean we assume the breakout is coming.
We still need price to confirm it.
A bullish Squeeze reversal, improving ADX, and a MACD cross would materially strengthen the case for a move through 776.85 and toward the upside targets.
But those signals haven't all arrived yet.
And there remains another possible path.
If SPY rolls over and prints a meaningful lower low from here, the recent bounce may prove insufficient and a deeper pullback could develop quickly.
That's why price structure remains more important than anticipating an indicator signal.
⸻
🧭 What Happens Next
1️⃣ Does the TTM Squeeze Turn Positive Again?
This may be the most important momentum tell.
The histogram has dipped slightly negative, but without the same downside momentum we saw during the previous negative cycle.
A quick reversal back through zero would be constructive and could indicate that momentum is rebuilding beneath price.
2️⃣ Does MACD Cross Bullish?
MACD hasn't confirmed yet.
If that bullish cross occurs alongside improving Squeeze momentum, we'd have considerably stronger evidence that this consolidation is preparing to resolve higher.
3️⃣ Can SPY Break 776.85?
This remains the actual price confirmation.
A sustained move above bull flag resistance would put:
782.24 → 789.84 → 806.36
back into focus.
4️⃣ Does the Recent Low Hold?
If price instead rolls over and makes another lower low, the bull case becomes less immediate.
The bullish defense zone between 758.61 and 747.34 would become critical again.
As long as 747.34 holds, the larger bull flag remains structurally intact.
Below that, the roadmap changes materially.
⸻
🎯 Trading Plan
We're getting closer, but there's still no reason to front-run the breakout.
Last week's pullback accomplished something important:
It gave the market room.
Price tested lower, found buyers just above the bullish defense structure, and rebounded.
Now we want momentum to confirm that those buyers have enough strength to carry the move forward.
The best bullish sequence from here would be:
support holds → Squeeze turns positive → MACD crosses bullish → ADX strengthens → 776.85 breaks → 782.24 → 789.84
That would be the clean continuation setup we've been waiting for.
But until that sequence begins confirming, intraday price action should continue leading the way.
And remember, markets are closed Monday for Labor Day, so we're entering a shortened four-session trading week.
⸻
🎯 Bottom Line
The same bull flag remains active.
Pattern Start: 729.10
Low Anchor: 729.10
High Anchor: 776.85
Bullish Defense Zone: 758.61–747.34
Bull Flag Resistance: 776.85
Weekly Target: 782.24
Daily Target 1: 789.84
Daily Target 2: 806.36
Last week's pullback was healthy.
SPY stretched beneath the Bollinger Bands, found buyers just above the bullish defense zone, and rebounded toward resistance.
DMI remains bullish.
ADX has started rising.
The TTM Squeeze histogram has slipped slightly negative but is showing considerably less downside momentum than during its previous negative cycle.
MACD still needs to cross.
If those momentum studies begin aligning bullishly from here, another break above 776.85 would put the move toward 782.24, 789.84, and ultimately the 800 area firmly back in play.
But we don't need to predict it.
Let momentum confirm, let resistance break, then follow the move.
