
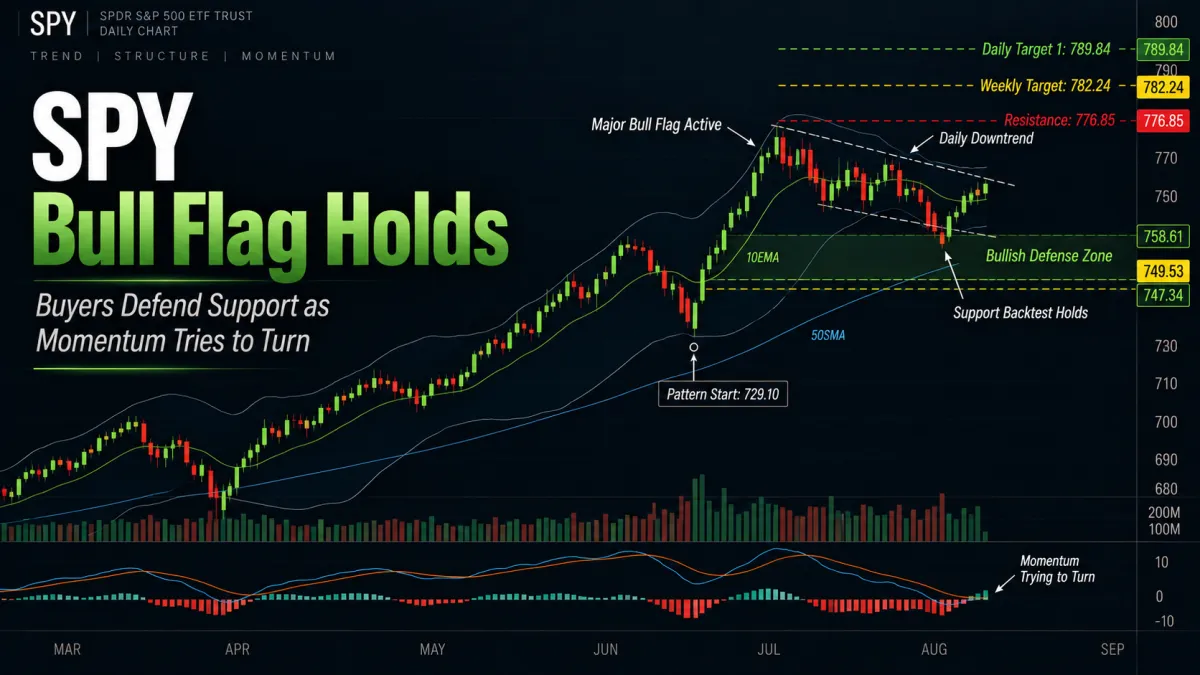
SPY Bull Flag Holds as Support Backtest Sets Up Next Move


📆 DAILY CHART OUTLOOK — SPY
Week of September 21, 2026
The daily chart is looking a little uglier than the weekly, but the larger bullish structure remains intact.
SPY spent most of last week trading below the daily 10EMA and continued working deeper into the bullish defense zone before buyers showed up where we expected them to.
Thursday and Friday then produced meaningful recoveries, with SPY ultimately reclaiming the 10EMA into Friday's close.
That's constructive.
But this is no longer the clean, early-stage bull flag we were watching several weeks ago.
The consolidation has become lengthy, Bollinger Bands have tightened significantly, and short-term momentum remains mixed. The existing bull flag is still our major daily pattern, but the next useful trading opportunity may come from a smaller minor pattern that develops inside of it.
For now, the first real clue that this consolidation is shifting back toward a bullish expansion phase will be a forceful break of the daily downtrend alongside improving momentum.
⸻
📌 Pattern State
Pattern State: Bull Flag Active
Pattern Start: 729.10 (7/29 low)
Low Anchor: 729.10 (7/29 low)
High Anchor: 776.85 (8/5 high)
Active Bull Flag Levels
0% Support: 729.10
38.2% Flag Support: 747.34
61.8% Flag Support: 758.61
100% Resistance: 776.85
127.2% Target 1: 789.84
161.8% Target 2: 806.36
Weekly Resistance / Structural Support: 749.53
Weekly Target 1: 782.24
Current Mode: Major bull flag remains active, but price is in an extended consolidation beneath the daily downtrend with short-term momentum still mixed.
Bullish Defense Zone: 747.34–758.61
Structural Invalidation: A sustained break below 747.34, particularly if accompanied by a loss of the reclaimed 749.53 weekly breakout level, would materially weaken the major bull flag and increase the probability of a deeper pullback.
⸻
🔄 Structural Sequence — What Happened Last Week
1️⃣ Monday — Consolidation Continues Below the 10EMA
Monday remained part of the same short-term bearish structure we've been tracking.
Price continued trading below the daily 10EMA while the market worked deeper into the active bull flag's defense structure.
There was still no evidence that the daily downtrend had been broken.
⸻
2️⃣ Tuesday — Sellers Keep Pressure on Price
Tuesday extended the weakness.
SPY remained underneath the 10EMA and continued pressing toward the lower portion of the recent trading range.
The broader bull flag remained intact, but bulls still hadn't regained short-term control.
⸻
3️⃣ Wednesday — Pullback Reaches Its Weakest Point
Wednesday brought another push lower as markets reacted to the Fed-related news.
Price continued deeper into the support structure before sellers finally began losing momentum.
That brought SPY directly into the area where we've repeatedly said buyers needed to show themselves if the larger bullish pattern was going to remain healthy.
⸻
4️⃣ Thursday — Buyers Respond Sharply
Thursday delivered that response.
After Wednesday's weakness, SPY bounced sharply and closed back above the daily 10EMA.
That was an important first step.
Buyers had successfully defended the larger support structure and briefly reclaimed short-term trend support.
But one strong session wasn't enough to declare the consolidation finished.
⸻
5️⃣ Friday — Support Retested, Buyers Return Again
Friday opened lower and retested both support and the daily 50SMA.
Buyers once again appeared.
SPY then rallied through the session and closed back above the 10EMA.
That leaves the market entering this week with support successfully defended—but still underneath the larger daily downtrend.
Friday was constructive.
It was not yet a breakout.
⸻
📐 Immediate Structure Map
The daily setup now has two layers:
the major bull flag that has been developing since late July, and the potential for a new minor pattern to form inside of it.
Major Pattern Resistance
Daily Downtrend
This is now the first hurdle.
Before getting excited about the larger bull flag breakout, bulls need to break the descending daily trendline with meaningful force.
A weak push above it that immediately fails would simply extend the consolidation.
We want follow-through.
776.85 — Major Bull Flag Resistance
This remains the actual breakout level for the major daily pattern.
Once price can sustainably clear 776.85, the larger continuation phase can finally begin.
Above that:
782.24 — Weekly Target 1
789.84 — Daily Target 1
806.36 — Daily Target 2
⸻
Bullish Defense Structure
758.61 — Upper Flag Support
749.53 — Weekly Breakout Support
747.34 — Lower Flag Support
Last week's low came almost directly into this broader support area, and buyers responded.
That keeps the major pattern alive.
As long as 747.34 remains intact, this consolidation is still occurring inside the larger bullish structure.
⸻
🔍 Momentum Context
This is where the market remains conflicted.
There are bullish pieces developing—but they haven't aligned yet.
1️⃣ MACD — Can Bulls Reclaim Momentum?
MACD remains an important watch.
The average value remains above the zero line, but current momentum readings have slipped below it.
That creates a race of sorts.
Can bulls produce enough upside momentum to force a bullish MACD cross before the average value itself slips beneath zero?
If they can, that would be a meaningful sign that momentum is turning higher before the longer-term daily structure deteriorates.
If the average falls beneath zero first, the probability of additional downside or a longer consolidation increases.
⸻
2️⃣ TTM Squeeze — Can the Histogram Turn Positive?
The TTM Squeeze histogram continues printing negative values.
This is another critical signal.
What we want to see now is a reversal:
negative momentum → flattening → positive momentum
If the histogram crosses back above zero before MACD deteriorates further, that would be a strong indication that bulls are beginning to rebuild energy underneath price.
That signal would become even more meaningful if it coincides with a break of the daily downtrend.
⸻
3️⃣ DMI + ADX — Does Trend Strength Return With the Bulls?
ADX has finally begun rising on the daily timeframe.
That's notable because ADX spent weeks declining during this consolidation.
But rising ADX alone isn't enough.
Right now DI- remains above DI+.
What we want to see is:
DI+ cross back above DI- while ADX continues rising.
That would tell us two things simultaneously:
directional strength is returning
that strength is returning in favor of buyers
Combine that with a bullish MACD cross and a positive TTM Squeeze histogram, and we'd have a substantially stronger case that the consolidation phase is transitioning back into bullish expansion.
⸻
⚠️ Major Pattern vs. Minor Pattern
This distinction is increasingly important.
The existing 729.10 → 776.85 bull flag remains our major daily pattern.
Nothing has replaced it.
But this pattern has now spent a considerable amount of time consolidating.
Because of that, I don't expect the eventual continuation to necessarily behave like a fresh bull flag that breaks resistance and immediately races straight toward every extension target.
There's likely to be:
volatility
smaller pullbacks
retests
temporary consolidations
new short-term patterns developing along the way
The eventual move from this major bull flag should therefore be viewed as a multi-week and potentially multi-month continuation, not necessarily one short swing trade.
That's why I'm also watching for a new minor daily pattern.
If MACD, the TTM Squeeze, and DMI begin aligning bullishly, a smaller and cleaner pattern may form inside this larger structure.
That shorter-term setup could give us a much better tactical entry than trying to trade the entire major pattern in one shot.
When that structure appears, we'll map it separately while continuing to track the larger bull flag underneath it.
⸻
🧭 What Happens Next
1️⃣ Can Price Break the Daily Downtrend?
This is the first structural clue.
SPY doesn't need to reach 776.85 before giving us useful information.
A forceful break of the descending daily trendline would tell us that the sequence of short-term lower highs is beginning to change.
But we want strength behind it.
A weak breakout without momentum confirmation won't be enough.
⸻
2️⃣ Does MACD Cross Bullish?
This would be our next important momentum confirmation.
The sooner bulls can produce that cross while the average remains above zero, the better.
⸻
3️⃣ Does the TTM Squeeze Histogram Turn Positive?
This could be one of the strongest confirmation signals.
If the histogram transitions from negative back to positive while price breaks its downtrend, we'd have strong evidence that compression is beginning to resolve in favor of buyers.
⸻
4️⃣ Does DI+ Regain Control While ADX Rises?
ADX rising is encouraging.
Now we need that trend strength to align with the bulls.
A DI+ cross above DI- combined with a rising ADX would materially improve the daily momentum picture.
⸻
5️⃣ Does Support Continue Holding?
We still need to respect the other outcome.
If SPY rolls back over and loses the 747.34–749.53 structure, the bullish roadmap changes.
The major bull flag may still have broader support underneath it, but losing that defense area would tell us this consolidation is developing into something deeper.
⸻
🎯 Trading Plan
We're still in a market where patience matters.
The daily chart hasn't given us the confirmation needed to aggressively chase a new swing higher.
But we're beginning to see the pieces that could eventually produce one.
The ideal bullish sequence from here looks something like:
support holds → MACD crosses bullish → Squeeze turns positive → DI+ crosses above DI- → ADX continues rising → daily downtrend breaks → 776.85 breaks → 782.24 → 789.84
Those signals don't have to occur in that exact order.
But the more of them begin aligning together, the stronger the evidence that this consolidation is finally ending.
In the meantime, intraday setups remain the cleaner opportunity.
Friday gave us a perfect example.
IWM provided a clean ORBI breakdown shortly after the open, while QQQ delivered a strong breakout setup into the close.
That's exactly why we continue using intraday price action while the larger daily structure develops.
We don't need to sit around waiting for the swing chart to make up its mind.
We can trade the clean opportunities that appear inside the consolidation while patiently waiting for the larger move.
⸻
🎯 Bottom Line
The major daily bull flag remains active:
Pattern Start: 729.10
Low Anchor: 729.10
High Anchor: 776.85
Bullish Defense Zone: 747.34–758.61
Major Resistance: 776.85
Weekly Target: 782.24
Daily Target 1: 789.84
Daily Target 2: 806.36
Last week buyers successfully defended support and SPY reclaimed the daily 10EMA into Friday's close.
But the market remains underneath its daily downtrend, and momentum has not fully turned.
Now we're watching three things particularly closely:
MACD — can it cross bullish before its average loses the zero line?
TTM Squeeze — can the histogram turn positive again?
DMI / ADX — can DI+ regain control while ADX continues rising?
If those pieces begin aligning and price breaks the daily downtrend, we'll have our first strong indication that this long consolidation is finally shifting back toward bullish expansion.
And once 776.85 eventually gives way, the larger rally toward 782.24, 789.84, 806.36 and new highs can begin.
Just don't expect that entire move overnight.
After this much consolidation, we're increasingly looking at a larger continuation that may unfold over weeks or even months, with plenty of shorter-term trading opportunities developing along the way.
For now:
trade the clean intraday setups, respect the major support structure, and let the daily chart prove when the next swing phase has actually begun.
