
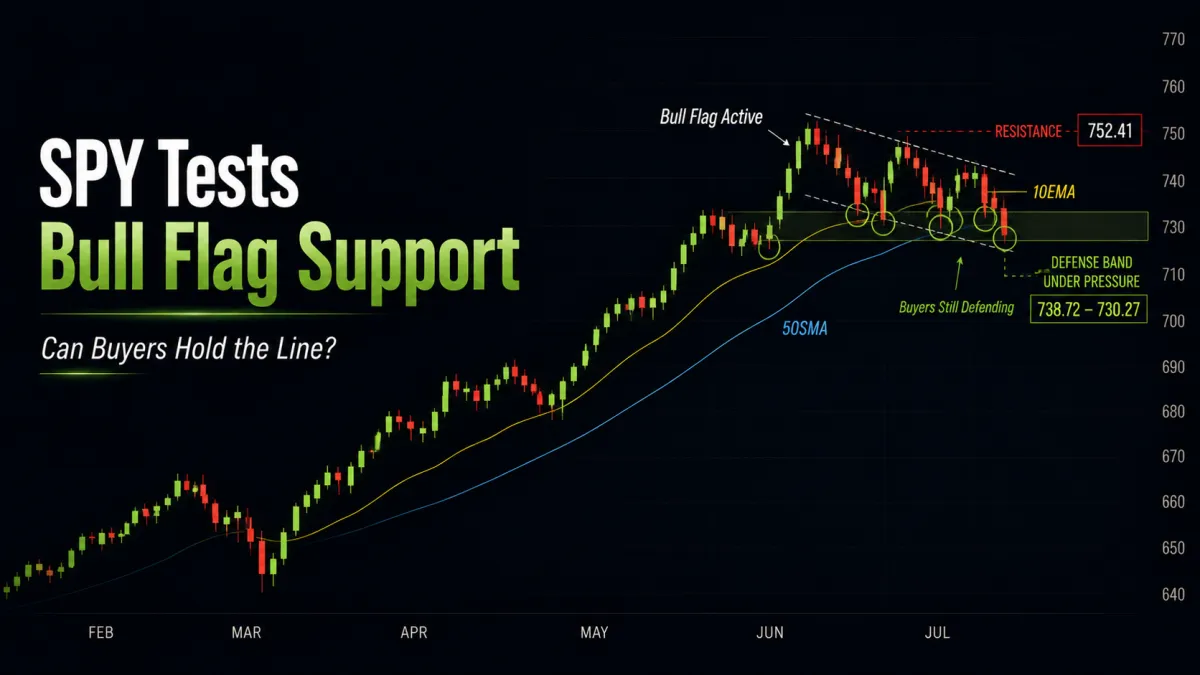
SPY Bull Flag Holds as Buyers Defend Critical Support

📈 DAILY CHART UPDATE — SPY
The daily bull flag remains intact, but it is now being tested.
After completing the bull flag breakout two weeks ago, price has spent the last week pulling back into its bullish defense band as sellers attempt to regain control. So far, buyers have continued to defend the area, but each test gradually absorbs more demand.
The longer this support zone is tested, the more important it becomes.
Last Week’s Price Action
Monday: Price opened higher before selling off throughout the session, closing back below the 50SMA.
Tuesday: Markets again opened stronger. After selling into Monday’s range early, buyers stepped in and pushed price back toward weekly resistance into the close.
Wednesday: Price opened slightly lower, rallied back into weekly resistance, then sellers regained control into the afternoon.
Thursday: Markets gapped directly into our bullish defense band. After an initial selloff, buyers aggressively defended support and pushed price sharply higher midday before sellers returned. A strong late-day rebound kept the defense band intact.
Friday: Price opened back above the upper edge of the support band, retested support once again, found buyers, rallied strongly through midday, but sellers faded the move into the close.
The Pattern
The active pattern remains the daily bull flag.
Every pullback has continued finding buyers above the lower defense level at 730.27, meaning the larger bullish structure has not failed.
However, that defense zone is being tested repeatedly.
Every successful defense is constructive.
Every additional test also consumes buyers waiting at those levels.
Eventually one side wins.
The Levels That Matter
Bullish Scenario
As long as price continues holding above 730.27, the bull flag remains active.
A successful defense followed by renewed buying would likely shift attention back toward:
Weekly Resistance: 749.53
Daily Resistance: 752.41
A breakout above those levels would place the existing bull flag continuation back in motion toward:
Target 1: 762.16
Target 2: 774.55
Bearish Scenario
If buyers finally lose 730.27, the bull flag would fail.
That would likely trigger the next leg lower as price begins retracing toward the larger weekly support structure we’ve been discussing over the past several weeks.
That remains the higher-timeframe support area where we’d expect stronger institutional buying interest to appear.
Momentum
Unlike the weekly chart, the daily timeframe is beginning to show genuine deterioration.
MACD is approaching a move below the zero line.
TTM Squeeze momentum is fading and looks ready to roll negative.
RSI continues holding below 50.
DMI remains bearish with ADX beginning to rise.
Individually those aren’t enough to reverse the larger trend.
Together they tell us sellers currently have the momentum advantage on this timeframe.
Trading Plan
This remains an environment where patience pays.
The larger weekly trend continues to favor higher prices over time, but the daily chart suggests we’re still working through a healthy consolidation where buyers and sellers are battling around an important support zone.
As long as price continues holding above 730.27, the active bull flag remains intact and another breakout toward 762.16 and 774.55 remains the higher-probability outcome.
If that support fails, the next likely destination becomes the weekly support zone around the 700 area, where we’d expect stronger institutional buyers to begin stepping back in.
While long swing opportunities have become more selective during this consolidation, another strategy is becoming increasingly attractive.
As strong stocks pull back into support while implied volatility remains elevated, premium selling begins to offer favorable opportunities. Selling out-of-the-money cash-secured puts on companies you’d already be comfortable owning at lower prices can be an excellent way to generate income while waiting for the next sustained breakout.
My own framework is intentionally simple. I generally focus on 30–45 DTE puts with less than roughly a 0.20 delta, then look to buy the position back once approximately 50% of the premium has been captured rather than holding through expiration. The objective isn’t to maximize every trade—it’s to consistently collect premium while managing both risk and capital efficiently.
To simplify finding those opportunities, I’ve built a Cash-Secured Put Scanner specifically around that process. Rather than manually searching through hundreds of option chains, the scanner filters the market and surfaces the setups that best fit this premium-selling framework.
You’ll find the scanner directly below this week’s Weekly Watchlist, and Momentum Ignition Point members can also access it anytime inside the Ignition Point Member Area alongside our Bullish and Bearish scanners.
In the meantime, ORBI intraday setups remain the primary focus for long option trades while the market works through this consolidation. Once this range resolves and momentum expands again, we’ll be ready to shift more aggressively back toward swing opportunities.
