
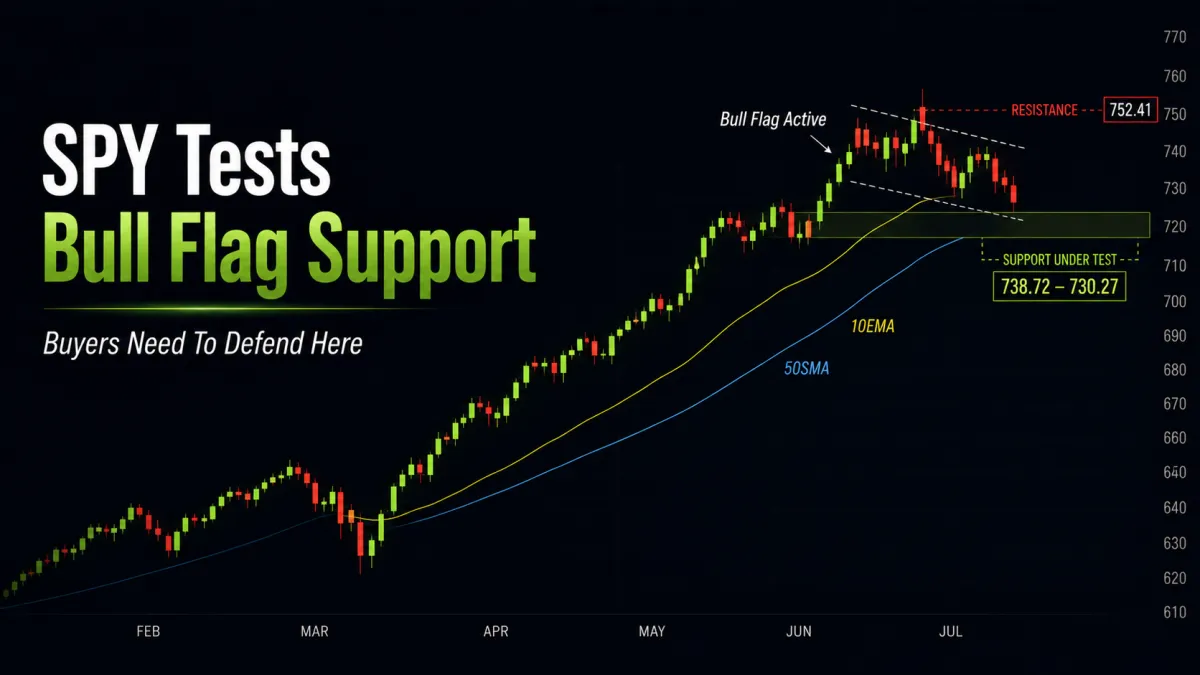
SPY Pulls Back From Breakout Attempt — Can Bulls Defend Support?
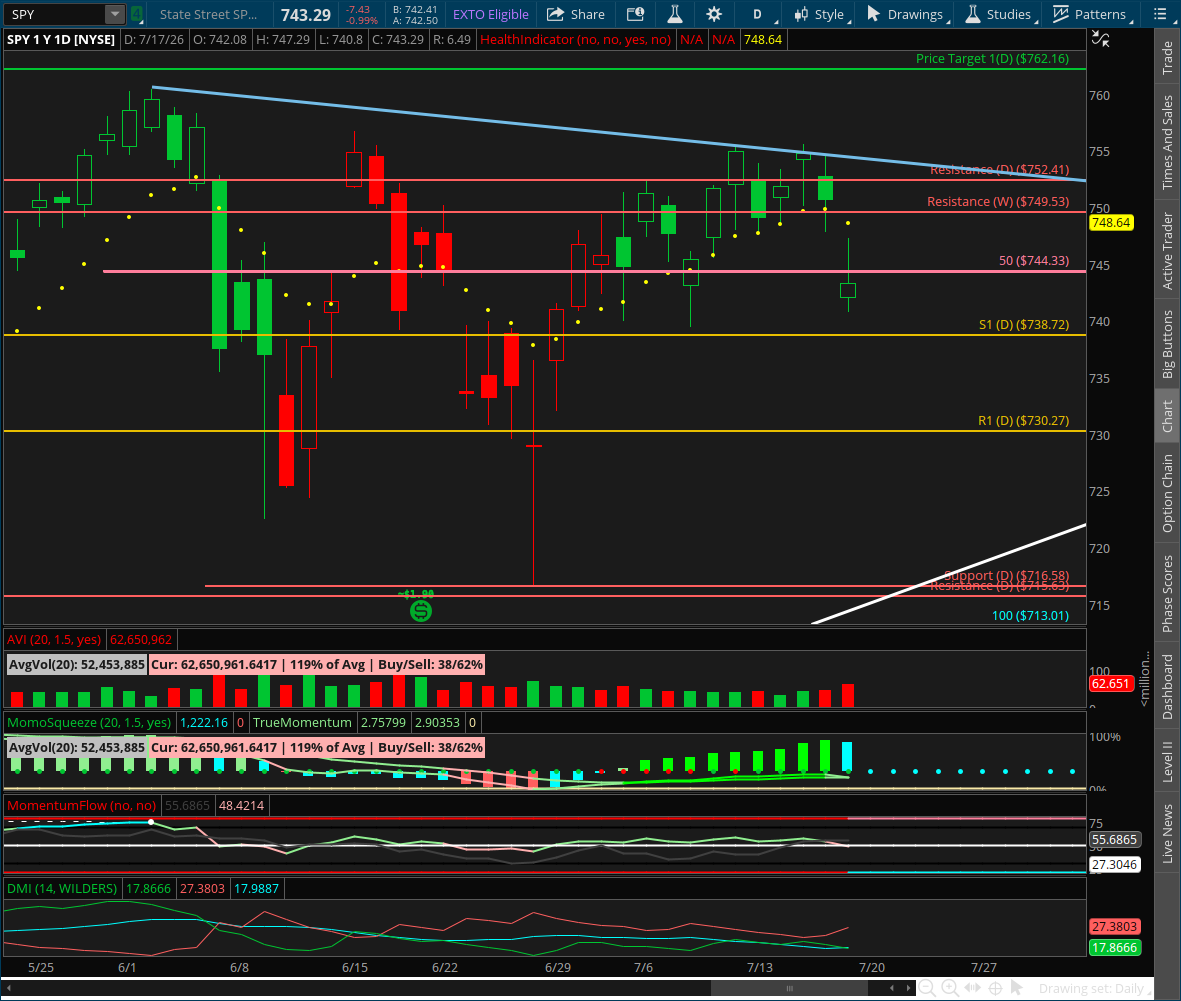
📆 DAILY CHART OUTLOOK — SPY
Week of July 20, 2026
The daily bull flag remains active, but last week’s breakout attempt failed to generate sustained continuation.
Price opened the week back below resistance and spent several sessions fighting to reclaim the breakout. Although buyers repeatedly defended the daily 10EMA, Friday’s news-driven gap lower finally broke that support and pushed SPY below the weekly breakout level and the 50SMA.
That does not invalidate the broader bull flag yet.
It does, however, take the pattern out of continuation mode and shift the immediate focus toward whether buyers can defend the daily support band below.
The market remains highly headline-driven, with price action still reacting sharply to developments surrounding the conflict in Iran. In this environment, price and the established structural levels matter more than expectations.
⸻
📌 Pattern State
Pattern State: Bull Flag Active
Low Anchor: 716.58 (6/26 low)
High Anchor: 752.41 (7/6 high)
Continuation Trigger: Friday, 7/10 close above 752.41 confirmed bull flag continuation
Current Mode: Continuation paused after price lost the daily 10EMA
Defense Band: 738.72–730.27
Structural Invalidation: A close below 730.27 would break the bull flag defense band and materially invalidate the current bullish structure
⸻
🔄 Structural Sequence (What Happened)
1️⃣ Monday — Breakout Lost, 10EMA Holds
Monday gapped lower and opened back below bull flag resistance at:
752.41
That immediately weakened the prior Friday breakout.
However, price remained above the daily 10EMA, which kept the active bull flag in continuation mode for the time being.
⸻
2️⃣ Tuesday — Bullish Inside Bar
Tuesday printed a bullish inside bar.
Price compressed inside Monday’s range while continuing to hold above the 10EMA.
That kept the breakout recovery attempt alive but did not provide enough expansion to restart the trend.
⸻
3️⃣ Wednesday — Resistance Reclaimed, Downtrend Still Intact
Wednesday gapped higher, pulled back to retest 752.41, and held above that level into the close.
Price also printed a higher high.
However, the rally still failed to break the minor daily downtrend that has been developing for a little over a month.
That left the market above resistance, but without the momentum confirmation needed for clean continuation.
⸻
4️⃣ Thursday — Breakout Lost Again, 10EMA Defended
Thursday gapped lower and lost the breakout above 752.41 again.
Buyers still defended the daily 10EMA, preventing a larger structural breakdown and keeping the bull flag technically active.
But the repeated failure to hold above resistance showed that momentum remained weak and the breakout was not yet ready to expand.
⸻
5️⃣ Friday — 10EMA, Weekly Resistance, and 50SMA Lost
Friday brought a sharp news-driven gap lower.
Price lost:
the daily 10EMA
weekly resistance at 749.53
the 50SMA
Markets rallied during the morning and attempted to reclaim the 50SMA, but that recovery failed and price closed below it.
That close also pushed daily MACD into a bearish cross while DI- began rising and ADX crossed above DI+ and turned higher.
Those changes represent the clearest near-term warning since the bull flag breakout began.
⸻
📐 Immediate Structure Map
The active bull flag remains intact, but continuation has paused.
Resistance to Reclaim
50SMA
749.53 — weekly resistance
752.41 — bull flag resistance
minor daily downtrend overhead
Immediate Support / Defense Band
738.72 — upper support
730.27 — lower support
Deeper Structural Support
716.58 — bull flag anchor low
weekly support structure near the 703 area
The first near-term test is whether buyers defend the 738.72–730.27 support band.
⸻
🔍 Momentum Context
The daily momentum picture has weakened.
• MACD crossed bearish
• DI- is rising
• ADX crossed above DI+ and is turning higher
• Price lost the 10EMA
• Price lost the 50SMA
• The prior breakout above 752.41 failed to hold
DMI had been the one indicator warning us that momentum was not fully prepared for the prior breakout.
That warning now matters more.
The daily is not yet in a confirmed bearish trend, but the momentum shift suggests that a support test is increasingly likely unless buyers reverse the move quickly.
⸻
⚠️ Important Structural Note
The bull flag is still active because its broader support structure has not yet failed.
But the pattern is no longer in clean continuation mode.
The market now has two primary paths.
1️⃣ Immediate Bullish Recovery
If buyers reverse direction early this week and reclaim:
the 50SMA
weekly resistance at 749.53
and bull flag resistance at 752.41
then the breakout can be attempted again.
A fast recovery would suggest Friday’s move was primarily headline-driven volatility rather than the beginning of a larger structural correction.
2️⃣ Support-Band Retest
If price remains below the 50SMA and continues lower, the next likely destination is the daily support band between:
738.72 and 730.27
If buyers defend that area, the bull flag can remain active while the market consolidates and rebuilds momentum.
If 730.27 fails on a closing basis, then the current bull flag structure materially weakens and the probability of a broader weekly pullback rises.
That would put:
716.58
and eventually the weekly support area near 703
back into focus.
⸻
🧭 What Happens Next
1️⃣ Can Price Reclaim the 50SMA Quickly?
An early reclaim would be the first sign that Friday’s breakdown is being rejected.
Without that reclaim, near-term pressure remains pointed toward support.
2️⃣ Does the 738.72–730.27 Defense Band Hold?
That is the most important immediate test.
If it holds, the market can remain inside bullish consolidation and prepare for another breakout attempt later.
3️⃣ Does Price Close Below 730.27?
A close below the lower edge of the defense band would invalidate the current support structure and make a deeper weekly pullback increasingly likely.
4️⃣ Does Momentum Reverse?
For bulls to regain clean control, we will want to see:
MACD recover
DI+ begin strengthening
DI- roll back over
ADX stop expanding with bearish directional pressure
Until then, the daily momentum picture deserves caution.
⸻
🎯 Bottom Line
The daily bull flag remains active, but continuation is no longer underway.
Last week’s breakout failed to hold, and Friday’s decline took price below the:
daily 10EMA
weekly breakout level
50SMA
That leaves the market vulnerable to a retest of the 738.72–730.27 defense band.
The next move now depends on whether buyers reverse Friday’s weakness quickly or allow price to continue rotating toward support.
For now:
716.58 remains the bull flag anchor low
752.41 remains bull flag resistance
738.72–730.27 is the immediate defense band
a close below 730.27 would materially weaken the active pattern
a fast reclaim of the 50SMA and resistance would reopen the breakout path
The market is always right.
Our job is not to guess what it should do next, but to follow what price confirms at the levels already in play.
