
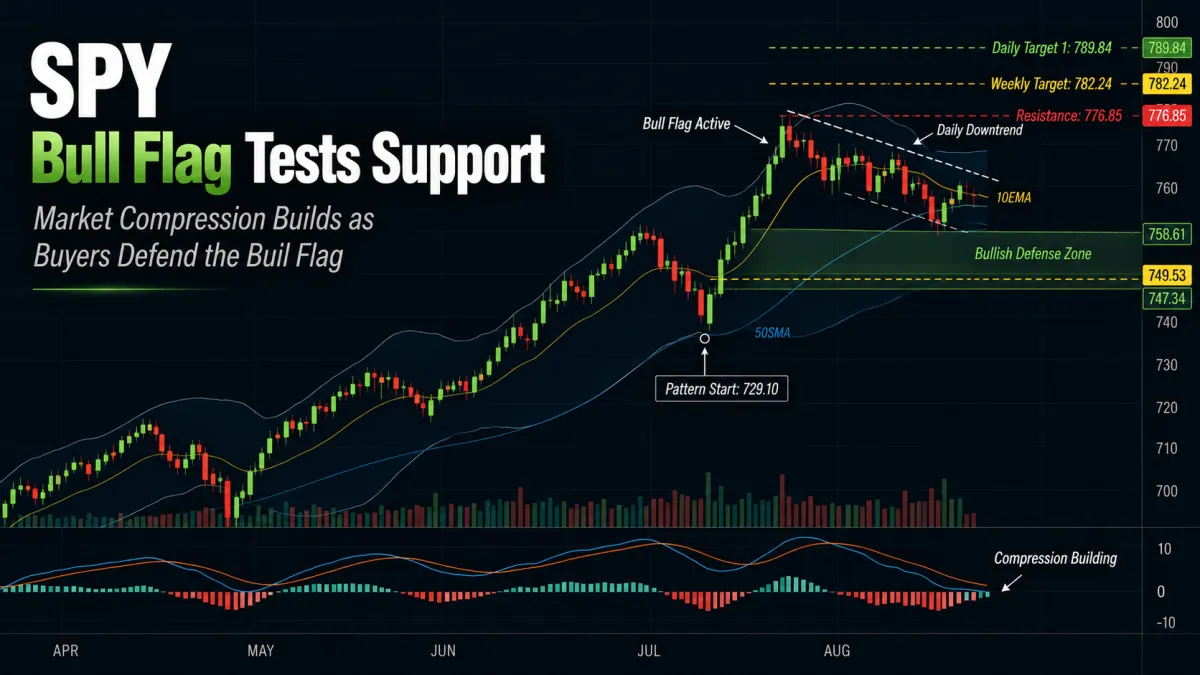
SPY Bull Flag Tests Support as Market Compression Builds
📆 DAILY CHART OUTLOOK — SPY
Week of September 14, 2026
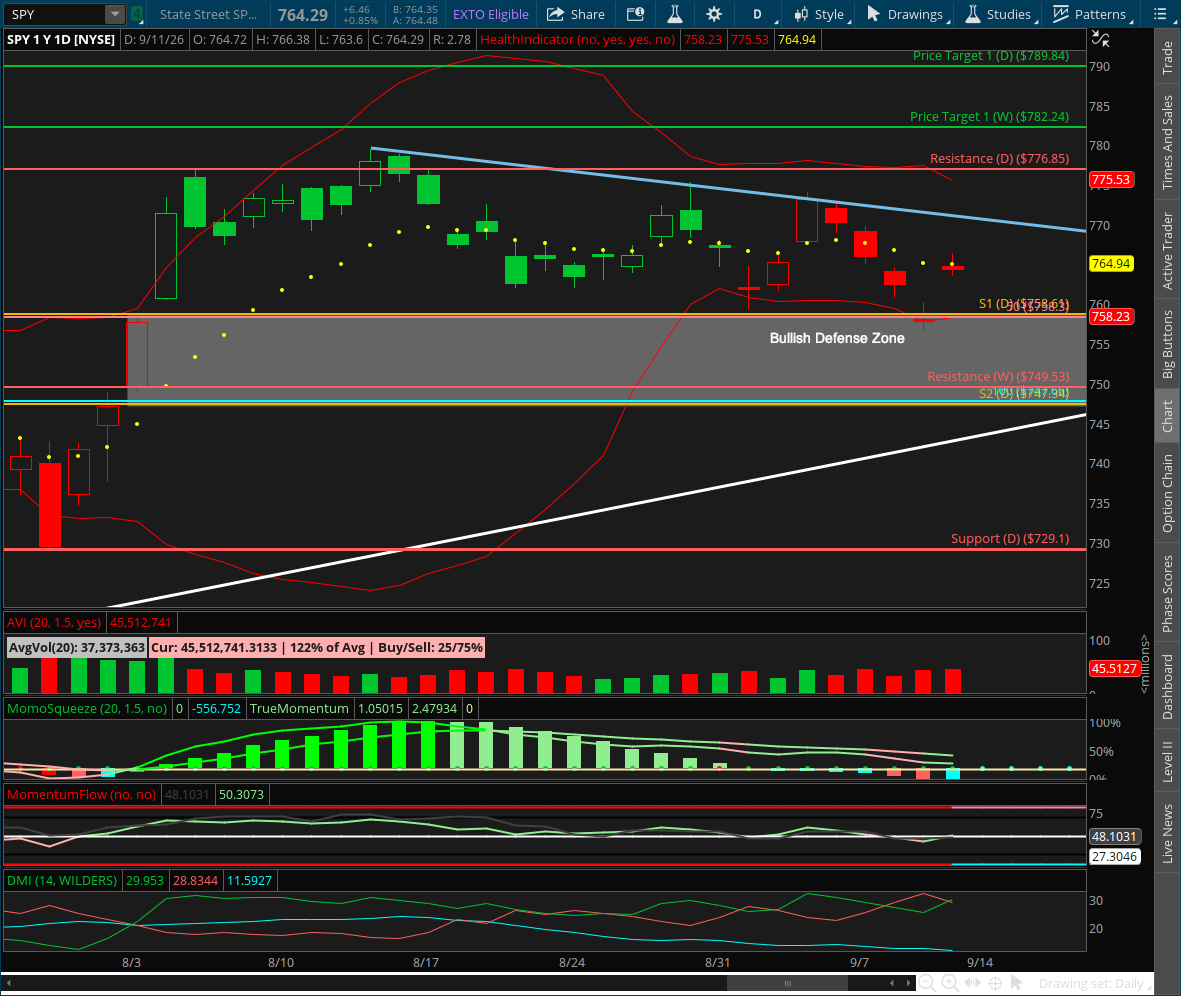
The daily chart remains in consolidation, and last week brought SPY directly into the area where we wanted to see buyers defend the active bull flag.
Price pulled back into the bullish defense zone, found buyers, and rallied sharply off the lows into Friday’s close.
That’s constructive.
But the daily chart has not confirmed that the next upside leg is ready yet.
SPY remains below the daily 10EMA, remains underneath the developing daily downtrend line, ADX continues declining, Bollinger Bands continue tightening, and momentum studies remain mixed.
That leaves us in essentially the same position we’ve been preparing for:
the broader bullish structure remains intact, but price still needs to prove that it’s ready to break out of this consolidation.
⸻
📌 Pattern State
Pattern State: Bull Flag Active
Pattern Start: 729.10 (7/29 low)
Low Anchor: 729.10 (7/29 low)
High Anchor: 776.85 (8/5 high)
Active Bull Flag Levels
0% Support: 729.10
38.2% Flag Support: 747.34
61.8% Flag Support: 758.61
100% Resistance: 776.85
127.2% Target 1: 789.84
161.8% Target 2: 806.36
Weekly Resistance / Structural Support: 749.53
Weekly Target 1: 782.24
Current Mode: Bull flag consolidation; price is testing the bullish defense structure while remaining below the daily 10EMA and daily downtrend line.
Structural Invalidation: A sustained loss of the lower bull flag defense structure, particularly a break below 747.34 and reclaimed weekly resistance at 749.53, would materially weaken the active bullish structure and put a deeper pullback into play.
⸻
🔄 Structural Sequence — What Happened Last Week
1️⃣ Monday — Labor Day
U.S. markets were closed Monday for the Labor Day holiday.
That left us with a shortened four-session trading week.
⸻
2️⃣ Tuesday — 10EMA Lost Again
Markets opened lower Tuesday and sellers immediately took control.
Price sold off and lost the daily 10EMA again, reinforcing that the short-term trend had not yet recovered.
This was an important reminder that despite the larger bullish structure, the daily chart was still working through consolidation.
⸻
3️⃣ Wednesday — Pullback Continues
Wednesday extended the pullback.
Price continued working lower toward the bullish defense zone while remaining beneath the 10EMA.
The move wasn’t enough to break the larger bull flag, but it pushed SPY closer to the support area we’ve been watching for buyers to defend.
⸻
4️⃣ Thursday — Buyers Show Up in the Defense Zone
Thursday gave us the most important structural event of the week.
SPY gapped lower into support and pushed directly into the bullish defense area.
That’s where buyers finally stepped back in.
Rather than accelerating through support, price was defended and began rebounding from the zone.
This is exactly why we’ve continued treating this area as the primary buy/defense zone for the active bull flag.
⸻
5️⃣ Friday — Strong Rebound, but No Breakout Yet
Friday opened with a gap higher and continued the rebound from Thursday’s support test.
Buyers pushed price sharply off the week’s lows into the close.
But there’s an important distinction:
SPY still failed to close above the daily 10EMA and remained underneath the daily downtrend line.
So Friday was constructive, but it wasn’t confirmation.
Buyers defended where they needed to.
Now they need to prove they can take back short-term trend control.
⸻
📐 Immediate Structure Map
SPY is becoming increasingly compressed.
Resistance / Breakout Structure
Daily 10EMA
The first thing bulls need to reclaim.
Price tested this area Friday but couldn’t close above it.
Daily Downtrend Line
This is becoming increasingly important.
The market has been building beneath this declining trendline throughout the consolidation.
A forceful break through it would be one of our first indications that the balance is shifting back toward expansion.
776.85 — Bull Flag Resistance
This remains the actual bull flag breakout level.
782.24 — Weekly Target 1
The first major upside objective immediately beyond resistance.
789.84 — Daily Target 1
A successful continuation through the weekly target opens the door toward the first daily extension.
⸻
Bullish Defense Structure
758.61 — 61.8% Flag Support
Price pushed into this area last week and found buyers.
749.53 — Former Weekly Resistance
This remains one of the most important structural levels underneath the market.
747.34 — 38.2% Flag Support
This represents the lower boundary of the bullish defense structure we’re watching.
As long as this broader support area holds, the bull flag remains structurally intact.
⸻
🔍 Momentum Context
The daily momentum picture remains mixed.
ADX
ADX continued declining last week.
That tells us the daily chart still lacks meaningful trend strength.
It’s consistent with the compression we’re seeing in price and Bollinger Bands.
DMI
DMI has crossed back bullish.
That’s constructive and shows buyers regaining some directional control underneath the surface.
But with ADX still weak, we don’t yet have the trend strength needed to treat that signal as confirmation of a new expansion.
MACD
MACD remains above the zero line, but the indicator has not yet given us the bullish momentum confirmation we’re looking for.
Again, constructive longer-term positioning—but not enough yet.
TTM Squeeze
The Squeeze histogram remains negative.
That continues to tell us that momentum has not fully turned back toward expansion.
Combined with tightening Bollinger Bands, however, we’re increasingly seeing the conditions we’d expect ahead of a larger directional move.
The market is storing energy.
Now we need price and momentum to tell us which way that energy gets released.
⸻
⚠️ Important Structural Note
This consolidation has now lasted long enough that we shouldn’t necessarily expect the eventual breakout to produce a perfectly clean, straight-line move.
There’s been a lot of compression beneath resistance.
That can create volatility when the range finally resolves.
We could see:
a breakout
a retest
some chop around resistance
and then continuation as the larger move develops.
That’s important when thinking about trade management.
This may be a move that takes time rather than one that pays immediately.
But the duration of this consolidation also means that once genuine trend strength returns, the resulting move could have staying power.
⸻
🧭 What Happens Next
1️⃣ Can SPY Reclaim the Daily 10EMA?
That’s the first test.
Friday’s rebound brought price back toward it, but bulls couldn’t close above it.
Reclaiming and holding the 10EMA would be the first meaningful improvement in short-term structure.
2️⃣ Can Price Break the Daily Downtrend Line With Force?
This is arguably the more important near-term signal.
A weak poke through the trendline isn’t enough.
We want to see buyers push through it with enough momentum to demonstrate that this consolidation is actually resolving.
3️⃣ Does Momentum Confirm?
Ideally, we’d see several things begin happening together:
DMI remains bullish
ADX bottoms and begins rising
TTM Squeeze momentum turns positive
MACD strengthens
price reclaims the 10EMA
price breaks the daily downtrend
That combination would materially strengthen the case for the next move higher.
4️⃣ Does 749.53–747.34 Continue Holding?
As long as this lower support structure holds, bulls retain control of the larger setup.
A deeper failure through that area would change the character of the consolidation and put a larger pullback into play.
⸻
🎯 Bottom Line
The daily bull flag remains active.
Last week, SPY:
lost the 10EMA again
continued pulling back
reached the bullish defense area
found buyers at support
rallied sharply from Thursday’s lows
crossed DMI back bullish
but remained beneath the 10EMA and daily downtrend line
while ADX continued declining and the Squeeze histogram remained negative
That’s a mixed momentum picture inside an otherwise constructive bullish structure.
The market is now squeezing around support while Bollinger Bands continue tightening.
As long as the 749.53–747.34 area continues holding, we’re still looking for this consolidation to eventually resolve higher toward:
776.85 → 782.24 → 789.84 → 806.36
But we don’t need to guess when that move begins.
Let price reclaim the 10EMA.
Let the daily downtrend break.
Let momentum confirm.
Then let the bull flag do its work.
Until that happens, intraday price action leads the way while the larger swing setup continues building.
