
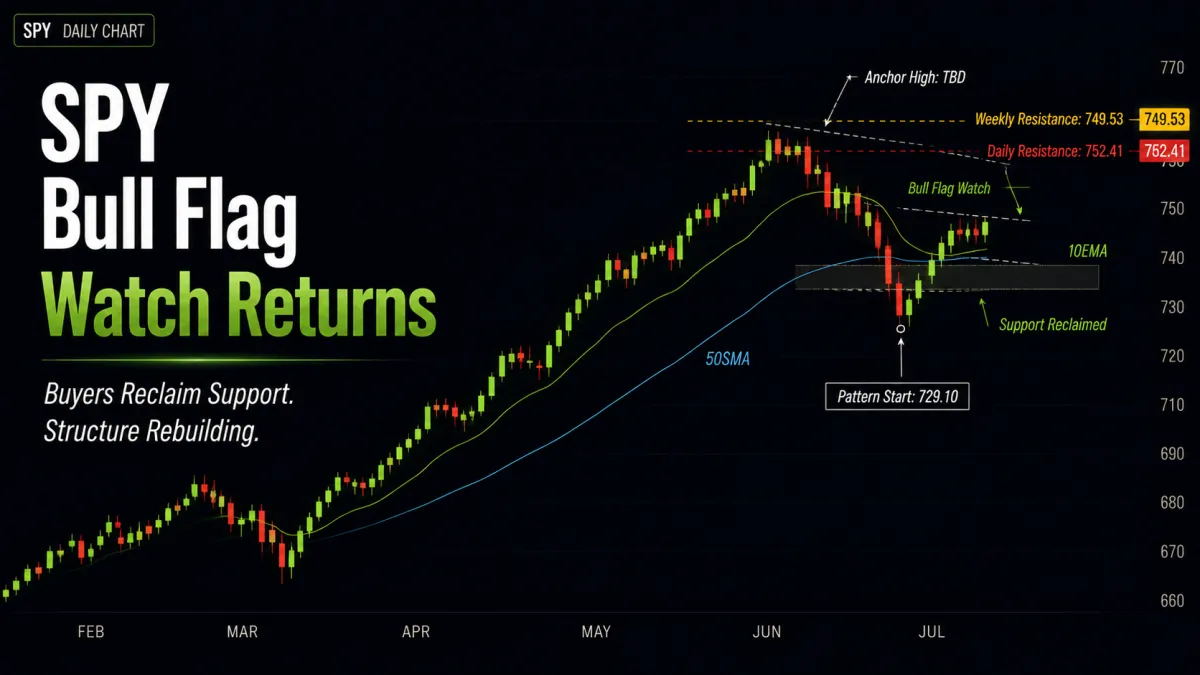
SPY Bull Flag Watch Returns After Previous Pattern Failed

📆 DAILY CHART OUTLOOK — SPY
Week of August 3, 2026
The daily chart shifted meaningfully last week.
The previous bull flag officially failed after Wednesday’s close broke below the 730.27 defense band. Rather than continuing lower, however, buyers immediately stepped back in and completely reclaimed the breakdown over the final two trading sessions.
That quick reversal has now put the market back on Bull Flag Watch.
There is no active completed bull flag yet, but the price action is beginning to build the next bullish structure inside what continues to look like a broader consolidation phase on the weekly chart.
📌 Pattern State
Pattern State: Bull Flag Watch
Pattern Start:729.10 (7/29 low)
Anchor High: Not yet established
Trigger: Bull flag formation remains underway until price prints the first lower high and lower low, which will establish the new pattern high and defense structure.
🔄 Structural Sequence (What Happened)
1️⃣ Monday — Support Holds
Monday opened higher before selling back into support throughout the session.
Although sellers controlled most of the day, buyers defended the developing support area and prevented any meaningful continuation lower.
The market remained under pressure, but downside momentum was already beginning to slow.
2️⃣ Tuesday — Support Tested Again
Tuesday spent much of the session retesting support.
Price continued consolidating near recent lows while volatility compressed, keeping the newly developing bullish structure alive without yet confirming it.
3️⃣ Wednesday — Bull Flag Invalidated
Wednesday produced the largest move of the week.
Price broke decisively below the previous bull flag defense band, officially invalidating that pattern while briefly closing beneath both support and the lower Bollinger Band.
Ironically, this was exactly the type of event the Cash-Secured Put Scanner was designed to identify.
Volatility expanded while many high-quality market leaders pulled into support, creating several attractive premium-selling opportunities. Traders following the framework of selling approximately <0.20 delta, 30–45 DTE cash-secured puts with the intention of buying them back after capturing roughly 50% of the premium received had opportunities to exit many of those positions quickly as the market reversed higher.
4️⃣ Thursday — Buyers Immediately Respond
Thursday completely changed the tone.
Buyers stepped in aggressively, pushing price back inside the previous support area while reclaiming the daily 10EMA for the first time in more than a week.
That immediate recovery suggested Wednesday’s breakdown lacked meaningful follow-through.
5️⃣ Friday — Strength Continues
Friday opened with another gap higher before retesting support during the morning.
Buyers once again defended that area before SPY rallied into the afternoon, closing back above both the daily 10EMA and the 50SMA.
By the end of the week, the breakdown had largely been erased and the market had shifted from bearish continuation back toward rebuilding bullish structure.
📐 Immediate Structure Map
The market is now attempting to build a new bull flag after successfully reclaiming the prior breakdown.
Resistance / Breakout Area
Weekly Resistance: 749.53
Daily Resistance: 752.41
Developing Bull Flag High: Not yet established
Support
Pattern Start: 729.10 (7/29 low)
Recent Higher-Low Structure above that level
Previous Bull Flag Support: 730.27 (now acting as nearby structural support)
As long as price continues holding above 729.10, the new bull flag remains in formation.
The next critical structural event is the first confirmed lower high followed by a lower low, which will establish the new pattern’s upper anchor and complete the bull flag.
🔍 Momentum Context
Momentum has improved considerably over the past two sessions.
The sharp reversal off Wednesday’s lows has stabilized several studies that were deteriorating earlier in the week.
MACD is attempting to reverse back higher.
DMI has begun stabilizing after sellers briefly gained control.
Price has reclaimed both the 10EMA and the 50SMA.
The weekly chart continues to favor longer-term upside once consolidation finishes.
The technical picture is improving, but confirmation still requires the new bull flag to complete first.
⚠️ Important Structural Note
This remains another patience pays phase.
The market has likely avoided a larger breakdown, but it has not yet provided the completed structure needed for a high-confidence swing entry.
There are currently two likely paths forward.
1️⃣ Bull Flag Completes and Breaks Higher
If buyers continue defending the July 29th low, the market should establish its first lower high and lower low, completing the new bull flag.
From there, a breakout above the newly established pattern high would likely target a retest of 749.53, 752.41, and potentially higher.
This remains the preferred bullish scenario.
2️⃣ More Consolidation Before Structure Completes
The second possibility is additional sideways rotation beneath resistance before the pattern fully develops.
That would still fit the broader consolidation we’ve been discussing for several weeks and would simply delay—not necessarily invalidate—the next breakout attempt.
🧭 What Happens Next
1️⃣ Does Price Hold Above 729.10?
As long as buyers continue defending the July 29th low, the developing bullish structure remains intact.
2️⃣ Does the New Bull Flag Complete?
The next confirmed lower high and lower low will establish the pattern’s upper anchor and define the complete level structure we’ll monitor going forward.
3️⃣ Do Momentum Indicators Continue Improving?
A bullish turn in MACD together with continued improvement in DMI would provide meaningful confirmation that the daily timeframe is beginning to realign with the longer-term bullish trend shown on both the weekly and monthly charts.
🎯 Bottom Line
The previous bull flag has been invalidated, but the breakdown failed almost immediately.
Buyers reclaimed both the 10EMA and the 50SMA into Friday’s close, leaving the market back on Bull Flag Watch rather than transitioning into a larger bearish trend.
The July 29th low at 729.10 is now the key anchor for the developing pattern.
The upper anchor has not yet been established.
Until that happens, patience continues to pay.
ORBI remains the best source of long-option opportunities during this consolidation, while the Cash-Secured Put Scanner continues to identify attractive premium-selling opportunities whenever volatility spikes and quality market leaders temporarily pull back into support.
The longer-term trend still favors higher prices.
Now we simply wait for the market to finish building the next structure before committing to the next swing move.
