
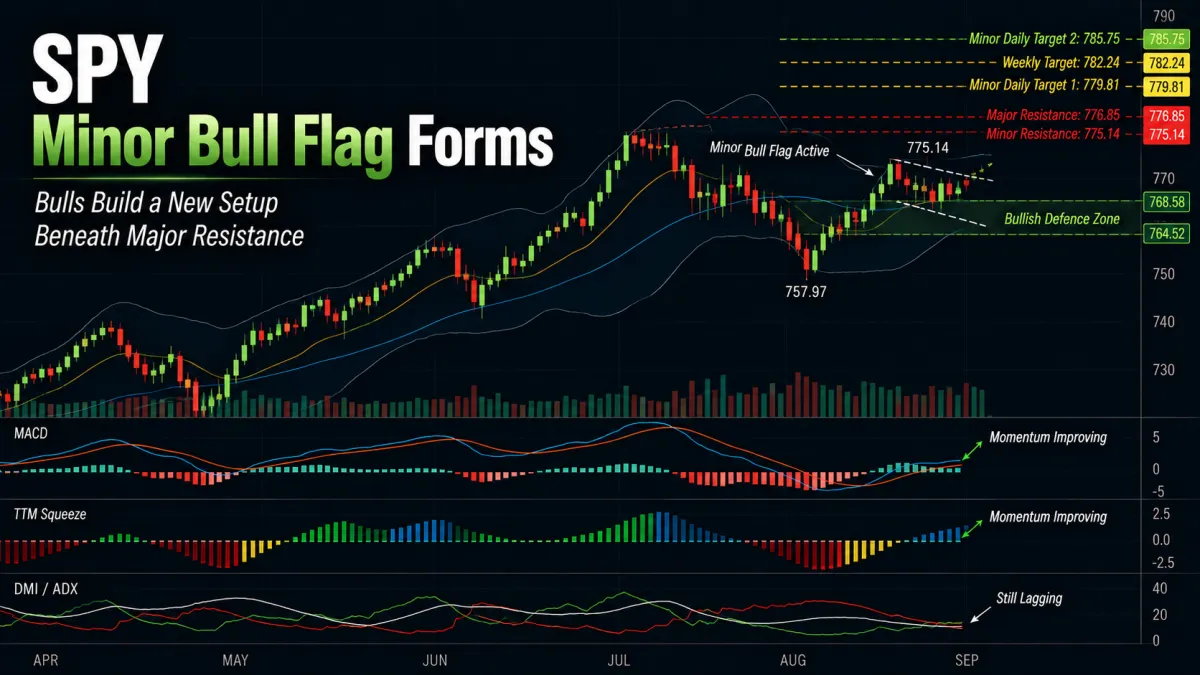
SPY Minor Bull Flag Forms Beneath Major Resistance
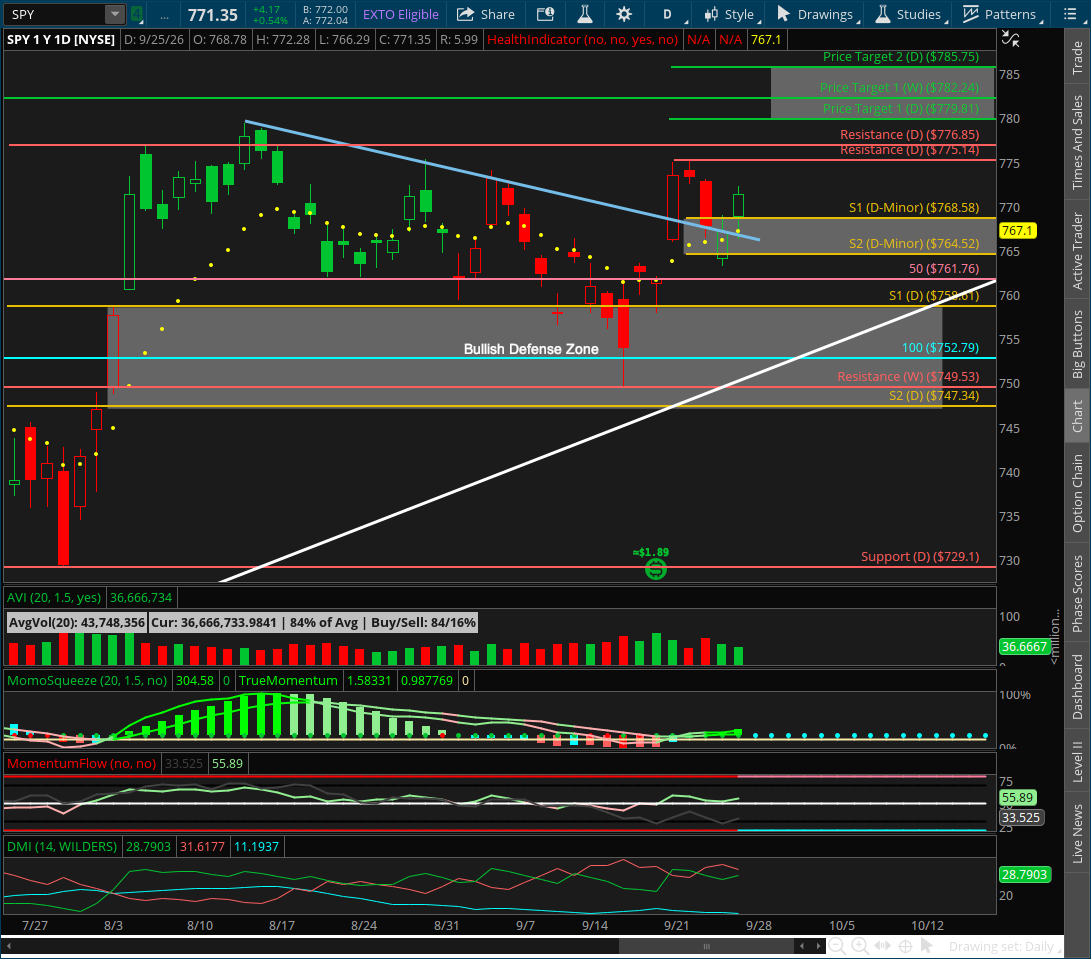
📆 DAILY CHART OUTLOOK — SPY
Week of September 28, 2026
Last week gave us the shorter-term structure we've been waiting for.
For several weeks, the larger daily bull flag had remained technically intact, but the amount of sideways consolidation inside that pattern made it increasingly less useful for navigating the market day to day.
We said a smaller, cleaner pattern would likely develop inside that larger structure and give us a better roadmap for the next move.
That appears to be exactly what happened.
After SPY broke the daily downtrend early last week and subsequently retested it, a new minor daily bull flag formed just beneath the major resistance area.
That smaller pattern is now our active guiding daily pattern.
The older major bull flag remains useful as broader structural context, particularly because its 776.85 resistance sits immediately above the new flag's breakout level, but it is no longer the pattern we're using to guide the daily market update.
⸻
📌 Pattern State
Pattern State: Bull Flag Active
Low Anchor: 757.97 (9/18 low)
High Anchor: 775.14 (9/22 high)
Active Bull Flag Levels
0% Support: 757.97
38.2% Flag Support: 764.52
61.8% Flag Support: 768.58
100% Resistance: 775.14
127.2% Target 1: 779.81
161.8% Target 2: 785.75
Current Mode: Minor bull flag active following the daily downtrend break. Price successfully defended the lower flag support last week and is rebuilding beneath resistance.
Bullish Defense Zone: 764.52–768.58
Structural Invalidation: A daily close below 764.52 would invalidate the active minor bull flag and put SPY back into the broader consolidation/chop that has dominated the daily chart.
⸻
🔄 Structural Sequence — What Happened Last Week
1️⃣ Monday — Daily Downtrend Breaks
Monday delivered the first major change we've been waiting for.
SPY gapped higher and rallied strongly enough to break the daily downtrend that had contained price throughout the recent consolidation.
That was our first indication that the short-term structure was beginning to change.
But as always, breaking a trendline is only the first step.
We still needed to see whether price could build a tradable pattern around the move.
⸻
2️⃣ Tuesday — New Anchor High Established
Tuesday opened relatively flat and stalled after Monday's expansion.
Price reached 775.14, establishing the high that now anchors our new minor bull flag.
That also placed SPY immediately underneath an important cluster of resistance:
775.14 — Minor Bull Flag Resistance
776.85 — Major Pattern Resistance
That resistance cluster will matter considerably when buyers make their next attempt higher.
⸻
3️⃣ Wednesday — Bull Flag Structure Develops
Wednesday brought the first meaningful pullback after the new high.
Price rotated lower into the newly developing flag structure, giving us the shorter-term consolidation we needed after Monday's breakout.
That is where this new pattern began becoming much more useful than the larger multi-month structure.
We now had a clearly defined low, high, and developing defense zone to follow.
⸻
4️⃣ Thursday — Lower Support Gets Tested
Thursday provided the most important test of the new pattern.
SPY gapped below the 764.52 lower flag support level intraday.
A daily close below that level would have invalidated the new minor bull flag almost immediately and sent us right back into the broader chop.
Instead, buyers showed up.
Price recovered the support structure and rallied enough to reclaim and close above the daily 10EMA.
That's exactly the kind of response we needed to see.
⸻
5️⃣ Friday — Buyers Follow Through
Friday opened back above the lower pattern support, filled the nearby imbalance, and then rallied into the close.
SPY finished near the session highs.
That leaves the new minor bull flag intact and puts price back into position to challenge resistance if momentum can continue improving.
⸻
📐 Immediate Structure Map
The shorter-term roadmap is now considerably cleaner.
Minor Bull Flag Resistance
775.14
This is the first breakout level.
A sustained daily close above 775.14 would activate continuation from the new guiding pattern.
But there's an important complication immediately overhead.
Major Pattern Resistance
776.85
This remains an important reference from the older major bull flag.
So the strongest bullish signal would not simply be a move above 775.14.
We want to see SPY clear the entire 775.14–776.85 resistance cluster.
That would provide much stronger evidence that the long consolidation is finally transitioning into the next expansion phase.
⸻
Upside Targets
Once that resistance cluster breaks:
779.81 — Minor Daily Target 1
Then:
782.24 — Weekly Target 1
And:
785.75 — Minor Daily Target 2
That creates a relatively tight upside target cluster.
The weekly target sitting between the two minor daily extensions is important because we should expect price to encounter some resistance there rather than assuming a straight-line move through every level.
⸻
Bullish Defense Zone
768.58 — Upper Flag Support
764.52 — Lower Flag Support
This is now the primary support zone for the active daily pattern.
Thursday already showed us buyers are willing to defend it.
As long as 764.52 continues holding on a daily closing basis, the new bull flag remains intact.
⸻
🔍 Momentum Context
Momentum has improved considerably, but it hasn't fully aligned yet.
That's why we're on breakout watch rather than declaring that the next rally has already begun.
MACD — Recovery Underway
MACD has recovered significantly.
That's an important improvement from where we were several weeks ago.
The indicator is increasingly supportive of another bullish attempt, but we still want price itself to confirm that momentum by clearing resistance.
⸻
TTM Squeeze — Histogram Turns Bullish
The TTM Squeeze histogram has rotated back into positive territory.
This is one of the developments we've been waiting for.
For several weeks, we specifically watched for:
negative momentum → flattening → positive momentum
That transition has now occurred.
It's an encouraging sign that energy may finally be rebuilding underneath price.
⸻
DMI + ADX — Still the Missing Piece
This remains the less convincing part of the setup.
DI- remains above DI+, while ADX is still essentially flat.
That tells us directional momentum hasn't fully shifted into the bulls' hands yet.
This is important.
MACD and the Squeeze are improving, but DMI hasn't confirmed that buyers have enough directional strength to sustain a larger expansion.
What we'd ideally like to see now is:
DI+ crosses above DI- → ADX begins rising → resistance breaks
If that happens alongside the improving MACD and bullish Squeeze histogram, we'd have much stronger confirmation that the next leg higher is actually underway.
⸻
⚠️ The Minor Pattern Is Now Our Guide
This is an important change from the last several weeks.
The larger 729.10 → 776.85 bull flag has not disappeared.
It remains the broader structural backdrop.
But after nearly two months of sideways development, that pattern has become too large and slow to serve as our primary tactical guide.
The new 757.97 → 775.14 minor bull flag is now the pattern that matters for the daily update.
That means:
775.14 tells us when short-term continuation begins.
768.58–764.52 tells us whether buyers remain in control.
779.81 and 785.75 give us the next actionable daily targets.
The larger structure becomes context rather than our daily north star.
That should give us a much cleaner framework to follow as the market attempts to emerge from this extended consolidation.
⸻
🧭 What Happens Next
1️⃣ Does 764.52 Continue Holding?
This is the first requirement.
Thursday demonstrated that buyers are already willing to defend this level.
As long as daily closes remain above it, the minor bull flag stays active.
A close below it invalidates the shorter-term pattern and sends us back into chop.
⸻
2️⃣ Does DI+ Cross Back Above DI-?
MACD and the Squeeze have already improved.
DMI is the missing piece.
A bullish DI cross would provide additional evidence that buyers are regaining directional control.
⸻
3️⃣ Does ADX Begin Rising?
We don't just want direction.
We want strength behind that direction.
If DI+ takes control while ADX turns higher, that would significantly improve the probability that the next breakout produces follow-through.
⸻
4️⃣ Can SPY Break 775.14 AND 776.85?
This is the real test.
A move above 775.14 activates the minor flag breakout.
But a move through 776.85 clears the resistance left behind by the major structure as well.
A forceful break of both levels would put:
779.81 → 782.24 → 785.75
directly into play.
⸻
5️⃣ How Does Price Behave Around 782.24?
Don't forget the weekly target.
Even if SPY breaks daily resistance cleanly, 782.24 remains an area where resistance should be expected.
The move may look more like:
breakout → 779.81 → test 782.24 → consolidate/retest → continue
rather than a straight-line rally.
That's completely normal.
⸻
🎯 Trading Plan
The daily chart finally gives us a much more navigable structure.
The ideal bullish sequence now looks like:
764.52 holds → DMI crosses bullish → ADX strengthens → 775.14 breaks → 776.85 breaks → 779.81 → 782.24 → 785.75
We're closer than we've been in several weeks.
MACD has recovered.
TTM Squeeze momentum has turned positive.
Price has broken the old daily downtrend.
The new minor bull flag survived its first support test.
Now we need directional strength and price confirmation.
Until then, ORBI and other intraday setups remain highly useful.
The larger market may still be consolidating, but that doesn't mean there aren't clean opportunities inside individual sessions.
The goal is not to predict when the market finally breaks out.
It's to stay aligned with the structures that are actually paying while we wait.
⸻
🎯 Bottom Line
We now have a new guiding daily pattern.
Pattern State: Bull Flag Active
Low Anchor: 757.97
High Anchor: 775.14
Bullish Defense Zone: 764.52–768.58
Minor Resistance: 775.14
Minor Target 1: 779.81
Weekly Target: 782.24
Minor Target 2: 785.75
The larger 776.85 major resistance remains an important reference immediately above the new flag breakout.
Last week:
SPY broke the daily downtrend
established the new minor bull flag
tested and defended its lower support
reclaimed the daily 10EMA
saw MACD recover
saw TTM Squeeze momentum rotate bullish
but DMI and ADX still failed to provide full directional confirmation
That's the setup.
The new minor bull flag is now our daily guide.
A clean breakout through 775.14–776.85 with improving DMI and ADX would be our strongest indication yet that SPY is ready to make its next attempt toward 779.81, 782.24, and 785.75.
If 764.52 fails on a daily close, the new pattern is invalidated and we're back to navigating the larger consolidation.
For now, bulls have the opportunity.
They just need to prove they have the momentum to use it.
