
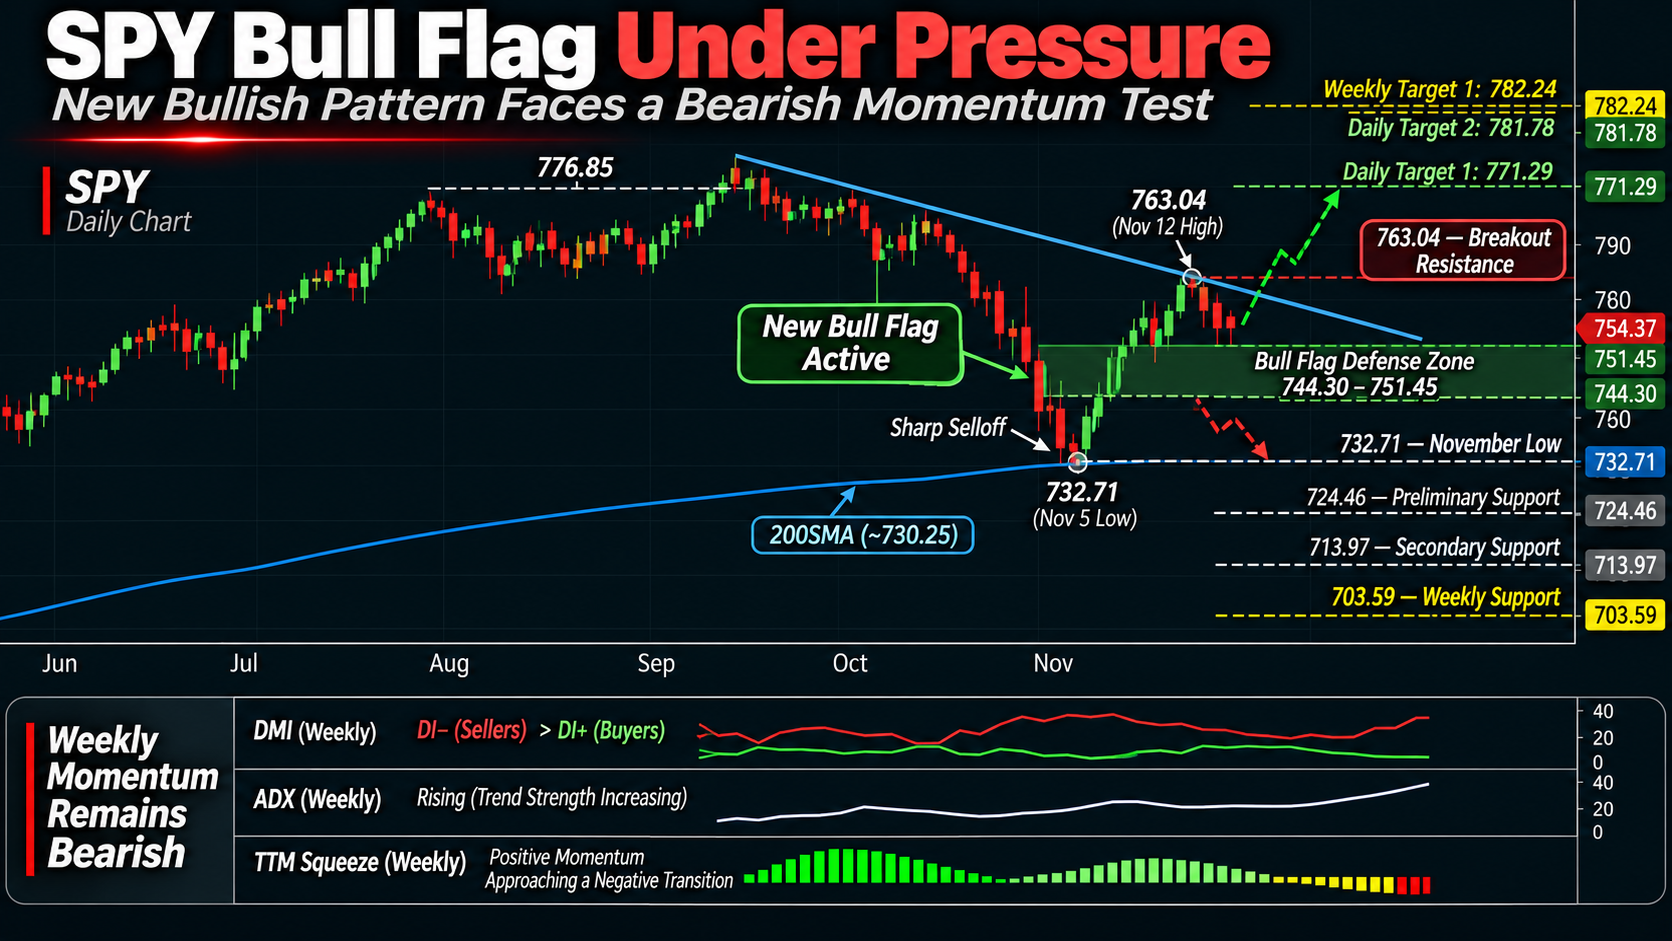
SPY Forms New Bull Flag as Bearish Momentum Threatens Recovery
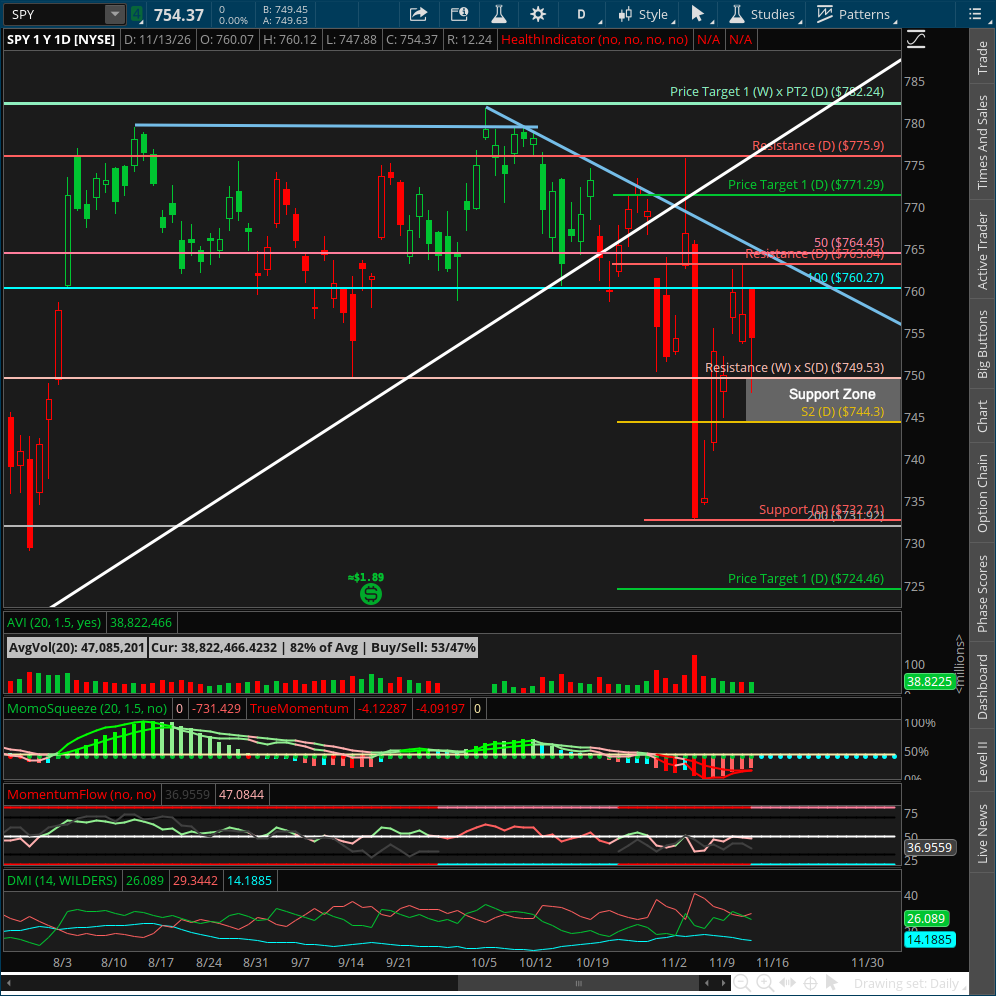
📆 DAILY CHART OUTLOOK — SPY
Week of November 16, 2026
Last week was a perfect example of why understanding market structure matters more than becoming attached to a particular directional outlook.
Going into the week, we were watching for a relief rally following the sharp selloff that had invalidated our major daily bull flag.
A new bearish continuation pattern was beginning to develop, but its low anchor had not yet been confirmed.
At the same time, SwingTraderPro had already given our traders a Buy signal the previous Friday, identifying the potential rebound from which the new bearish consolidation could develop.
That rebound arrived Monday, and it arrived with force.
But what followed was considerably more complicated.
By Wednesday, buyers had pushed price far enough to invalidate the newly formed bear flag.
Thursday established another high, and Friday produced the lower high and lower low needed to confirm an entirely new daily bull flag.
In other words, the market transitioned from:
Major bull flag invalidated → New bear flag forms → Bear flag invalidated → New bull flag forms
All within a matter of days.
That's the kind of whipsaw price action we've been warning about as the market attempts to work through the correction that began in October.
And while the new bull flag is technically valid, there's an important distinction between the pattern and the underlying momentum.
The daily bull flag is now our active pattern. But sellers still retain the broader directional advantage, and the weekly momentum picture continues threatening another move lower.
That means we have two competing developments to evaluate this week.
Can buyers defend the new bullish pattern and regain control?
Or is this simply another temporary recovery before the next bearish continuation develops?
Right now, I believe the downside remains the more likely outcome unless buyers demonstrate meaningful strength early in the week.
But the pattern gives us clearly defined levels to determine whether that expectation is correct.
📌 Pattern State
Pattern State: Bull Flag Active
Pattern Start: 732.71 (11/5 low)
Low Anchor: 732.71 (11/5 low)
High Anchor: 763.04 (11/12 high)
Active Bull Flag Levels
0% Support: 732.71
38.2% Flag Support: 744.30
61.8% Flag Support: 751.45
100% Resistance: 763.04
127.2% Target 1: 771.29
161.8% Target 2: 781.78
Pattern Confirmation: November 13, when Friday's candle established a lower high and lower low following Thursday's high.
Current Mode: Active daily bull flag undergoing its first support test. Price has recovered above the weekly breakout level at 749.53, but bearish directional momentum remains influential across the daily and higher timeframes.
Bullish Defense Zone: 744.30–751.45
Bullish Continuation Trigger: A sustained daily close above 763.04 would confirm a breakout from the active bull flag and put its upside targets into focus.
Structural Invalidation: A daily close below 744.30 would invalidate the active bull flag.
Critical Downside Confirmation: A subsequent daily close below the 732.71 low anchor and daily 200SMA would substantially strengthen the case for renewed bearish expansion toward lower support.
Important: The previous bear flag was invalidated Wednesday. It is no longer active. The bull flag established Friday is the sole guiding daily pattern until price invalidates it or a new structure takes its place.
🔄 Structural Sequence — What Happened Last Week
1️⃣ Monday — SwingTraderPro's Rebound Signal Pays Off
Coming into the week, we were looking for a rebound following the previous Thursday's aggressive decline.
SwingTraderPro had already identified that possibility on Friday, November 6, printing a Buy signal near the lows.
That signal was particularly useful because it appeared as the market was approaching the daily 200SMA following a major bearish breakdown.
The signal did not imply that the larger correction was over.
It identified an opportunity for a recovery within the developing bearish structure.
And Monday delivered.
SPY opened higher and rallied aggressively, reaching the first two retracement objectives established by SwingTraderPro:
61.8% Retracement — Reached
50% Retracement — Reached
Those were meaningful objectives for the developing bear flag.
Monday also confirmed that the November 5 low at 732.71 would serve as the low anchor for that bearish structure.
At this stage, everything remained consistent with the scenario we'd discussed the previous Sunday.
The initial bearish move had occurred.
Buyers were producing the recovery necessary to establish the countertrend portion of a bear flag.
And price was approaching the resistance zone where sellers might attempt to regain control.
The rebound was expected. The question was how far buyers could carry it before encountering resistance.
2️⃣ Tuesday — The Bear Flag Meets Resistance
Tuesday opened lower following Monday's strong recovery.
Sellers appeared as price entered the resistance zone established by the developing bearish pattern.
But rather than producing an immediate breakdown, SPY stabilized and printed a bullish inside bar.
Price also managed to close above the bear flag's 61.8% retracement level for a second consecutive session.
That was an important development.
The recovery wasn't accelerating, but buyers were continuing to defend the progress they'd made Monday.
And the inside bar extended the developing price structure without resolving the next directional move.
At this point, the bear flag remained our active pattern.
But the strength of the rebound was beginning to challenge the bearish continuation thesis.
Wednesday would provide the answer.
3️⃣ Wednesday — Buyers Invalidate the Bear Flag
Wednesday was considerably stronger than I had expected.
SPY pushed sharply higher, carrying price toward the daily 100SMA.
More importantly, the market closed above the 38.2% retracement level of the previously developing bearish pattern.
That invalidated the bear flag.
And just like that, the pattern we'd been monitoring for a potential continuation lower was no longer valid.
This is exactly why I emphasize following the structure rather than remaining committed to a directional opinion.
The bearish outlook may still have been supported by the higher timeframes.
But the specific bearish pattern had failed.
Once a pattern is invalidated, it no longer provides a valid framework for projecting or managing its continuation.
Wednesday's strength also began establishing the conditions for a new bullish structure.
The market had transitioned from bearish consolidation into another recovery attempt.
The question became whether buyers could sustain that move.
4️⃣ Thursday — Buyers Push Higher, Then Lose Momentum
Thursday opened lower but buyers initially regained control.
SPY pushed to another high, eventually reaching:
763.04 — November 12 High
That established the upper anchor of the new bullish structure.
But buyers couldn't maintain that strength.
Sellers returned, and price pulled back into the close.
That reversal matters because it showed that even after invalidating the bearish pattern, buyers were still struggling to establish a sustained directional advantage.
The market was no longer following the previous bear flag.
But it wasn't developing a convincing bullish trend either.
Instead, it was beginning to produce another consolidation structure.
Thursday gave us the new high. Friday would determine whether the corresponding bullish flag could be established.
5️⃣ Friday — The New Bull Flag Is Confirmed
Friday opened higher but quickly came under selling pressure.
SPY established a lower high and lower low relative to Thursday.
That confirmed the new daily bull flag.
The session's range was:
Friday Open: 760.07
Friday High: 760.12
Friday Low: 747.88
Friday Close: 754.37
The important development was where price found support.
SPY sold into the new bull flag's defense zone, trading beneath the weekly breakout reference at 749.53 before buyers returned.
The recovery carried price back above the upper portion of the defense zone, allowing SPY to finish the week at 754.37.
That kept the new bullish pattern intact.
But look at the broader context.
Price had just produced another substantial intraday reversal.
Sellers were still capable of driving SPY sharply lower.
And the market finished the week beneath the resistance levels that had repeatedly challenged the recovery.
The bull flag is valid. That does not mean the next move must be higher.
And with the higher-timeframe momentum picture remaining bearish, I'm particularly interested in whether buyers can continue defending its support early this week.
⚠️ Bull Flag to Bear Flag to Bull Flag — A Market Searching for Direction
This is the bigger takeaway from last week.
We've now watched the market transition rapidly between bullish and bearish structures.
The major bull flag that guided our analysis from August through October was invalidated.
The new bear flag that followed was confirmed Monday and invalidated Wednesday.
Then Thursday and Friday established another bull flag.
That's a lot of structural change in a very short period.
And it's consistent with the volatility we've been anticipating as the market transitions away from the sustained bullish momentum that dominated much of the year.
When a major trend begins unwinding, buyers and sellers don't simply agree on the next direction.
Buyers continue stepping into weakness.
Sellers use recoveries to establish or increase bearish exposure.
And the resulting price action can produce substantial reversals without establishing a sustained trend.
That's exactly the environment we're trading right now.
So I'm not interested in becoming overly confident simply because a new bull flag has formed.
Nor am I going to disregard that pattern because my larger expectation remains bearish.
The pattern is valid until invalidated.
And its levels give us an objective way to evaluate what happens next.
📐 The New Daily Bull Flag — A Clear Structural Roadmap
The new bull flag is anchored between:
732.71 — November 5 Low
and
763.04 — November 12 High
That gives us a defined bullish structure with a measurable support zone and upside targets.
751.45–744.30 — Bullish Defense Zone
This is the most important area heading into the week.
751.45 — 61.8% Flag Support
744.30 — 38.2% Flag Support
Friday's decline tested this zone.
Buyers eventually stepped in, and SPY recovered enough to close above 751.45.
That's constructive from the perspective of the new bull flag.
But I want to see whether that support can withstand another test.
If price begins moving lower early this week and sellers continue pressing through the zone, the new pattern could be invalidated almost as quickly as the previous bearish pattern was.
A daily close below 744.30 would invalidate the active bull flag.
At that point, the market would once again be without a confirmed continuation pattern, and I'd begin watching for the next bearish structure to develop.
749.53 — Weekly Breakout Support
This level sits inside the new bull flag's defense zone.
That's particularly important.
Two weeks ago, the weekly breakout failed.
Last week, buyers reclaimed it.
But Friday demonstrated just how unstable the battle remains.
SPY traded beneath 749.53 intraday before recovering above it by the close.
So the level continues to matter.
But it has not yet become the foundation for a renewed sustained bullish advance.
The bulls have reclaimed 749.53. They haven't convincingly established control above it.
And as long as sellers retain the broader momentum advantage, I expect this area to remain contested.
763.04 — New Bull Flag Resistance
This is now the most important immediate upside trigger.
A sustained breakout above 763.04 would confirm continuation from the active daily bull flag.
That would tell us buyers have overcome the resistance established Thursday and are attempting to regain directional control.
But because the higher-timeframe momentum remains bearish, I would want to see the breakout supported by improving momentum rather than simply a temporary push above resistance.
A strong breakout would put the next upside targets directly into focus.
🎯 Upside Targets — If Bulls Regain Control
If SPY defends the new support zone and breaks above 763.04, the bullish roadmap becomes much clearer.
771.29 — Bull Flag Target 1
This is the first upside objective generated by the active daily pattern.
It also sits near the resistance structure established during the earlier recovery.
A move into this area would be an important test of whether buyers are rebuilding genuine momentum.
775.90 — Daily Resistance
Above the first target, we have another established daily resistance level.
Price would need to work through this area before challenging the next major target cluster.
781.78–782.24 — Bull Flag Target 2 / Weekly Target 1
This is the most important overhead target region.
The bull flag's calculated 161.8% extension sits near 781.78.
Our established first weekly target remains at 782.24.
Together, those levels create an important resistance and profit-taking area.
If buyers can successfully break above 763.04 and develop strong momentum, I wouldn't rule out a move toward that region.
But given the weekly indicators and the developing correction, I remain skeptical that the market has enough strength to complete that move without another significant fight.
The upside opportunity exists. The momentum confirmation is still missing.
🔍 Daily Momentum — Sellers Still Have the Advantage
This is where the new bull flag becomes particularly interesting.
Price has established a technically valid bullish pattern.
But the daily indicators are not showing a convincing return to bullish trend strength.
The bearish momentum that developed during the earlier breakdown has moderated.
That's encouraging.
But it hasn't disappeared.
DMI — The Bearish Advantage Has Narrowed
The latest daily readings are approximately:
DI-: 29.34
DI+: 26.09
ADX: 14.19
Sellers still maintain a directional advantage.
But the spread between DI- and DI+ has narrowed considerably compared with the previous week's breakdown.
That's important.
The strong recovery earlier in the week helped buyers regain some directional strength.
At the same time, ADX has declined, indicating that the previous bearish trend strength has weakened during the rebound.
That supports the idea that the market is entering another period of consolidation.
But it doesn't establish bullish control.
The bears have lost some of their immediate momentum advantage. They haven't surrendered control of the larger correction.
For bulls, I'd want to see DI+ move decisively above DI- while ADX begins rising again.
That would provide much stronger evidence that the new bull flag is preparing for a sustained continuation.
Until then, I remain cautious.
TTM Squeeze — Bearish Momentum Has Moderated
The daily TTM Squeeze histogram remains negative.
But the negative readings have moderated from the more aggressive selling conditions seen during the previous week's decline.
That's consistent with the rebound and subsequent consolidation.
It tells us that immediate downside momentum has weakened.
But the histogram has not returned to a convincing positive configuration.
And that distinction matters.
A slowing bearish histogram can precede a bullish reversal.
It can also occur during a temporary countertrend rally before selling resumes.
The histogram tells us momentum is changing. Price structure tells us whether that change is becoming actionable.
Right now, the new bull flag is giving buyers an opportunity to prove themselves.
But the higher timeframes are still making that task difficult.
⚠️ The 4-Hour Timeframe Is Already Rotating Bearish
This is one of the developments I'm watching most closely heading into the new week.
Despite the new daily bull flag, the 4-hour timeframe was already beginning to rotate back toward bearish momentum by Friday's close.
That's concerning.
The daily pattern provides a bullish roadmap.
But if the 4-hour Squeeze begins expanding negatively before buyers can establish a breakout above 763.04, the market may find itself under renewed selling pressure while still inside the bull flag's support zone.
That would increase the probability of another pattern failure.
The magnitude of the negative 4-hour momentum cycle will be particularly important.
If the histogram only moves modestly negative before recovering, buyers may still have an opportunity to defend support and regain control.
But if negative momentum begins expanding aggressively, it becomes much more difficult to expect the bull flag to survive.
The 4-hour chart may give us the first useful warning before the daily structure actually breaks.
And with the weekly timeframe also approaching a potential negative momentum transition, that makes the next several sessions particularly important.
📉 The Weekly Squeeze Could Decide the Larger Move
We discussed this extensively in the weekly analysis.
The weekly TTM Squeeze histogram has been steadily losing positive momentum for months.
And while last week's recovery helped stabilize price, the weekly indicator remains close to turning negative.
If SPY begins this week with renewed selling and that weakness persists into the weekly close, I expect the histogram could move into negative territory.
That would be another meaningful development.
We would then have:
Bearish directional control on weekly DMI
Weekly ADX beginning to rise
A weekly Squeeze transitioning into negative momentum
A daily bull flag potentially failing at support
The 4-hour timeframe expanding bearishly
That's the kind of multi-timeframe alignment that could make the next bearish move considerably more convincing.
And it would make the path back toward the recent highs much more difficult for buyers.
The size of the negative weekly histogram will also matter.
A deeper negative cycle than the previous one would strengthen my expectation for a larger and longer correction.
A shallower cycle could instead suggest that selling pressure is beginning to exhaust itself and that the eventual recovery may arrive sooner.
But first, the market needs to show us whether that bearish transition actually develops.
⚠️ What Happens if the New Bull Flag Fails?
This is the downside scenario I'm preparing for.
If SPY begins the week moving lower and fails to defend the 751.45–744.30 support zone, the new bull flag could be invalidated.
That would be another rapid pattern failure inside this increasingly volatile market.
And if it happens while the 4-hour and weekly momentum indicators are turning more bearish, I'd expect renewed pressure on the November lows.
The next important test would be:
732.71 — November 5 Low Anchor
Alongside the nearby daily 200SMA.
A confirmed daily close below both would tell us sellers have overcome the buying interest that helped stabilize the previous decline.
That would materially strengthen the case for another bearish continuation.
And at that point, I'd begin watching for the next properly established bear flag to provide a more precise structural roadmap.
Until that new pattern forms, however, we can still use the existing support references to understand where price may find buyers.
🎯 Preliminary Downside Objectives
These are not confirmed targets from a new bear flag.
They're the existing technical references I'm watching if the active bull flag fails and selling resumes.
724.46 — First Lower Downside Reference
This is the first approximate downside objective beneath the November lows and 200SMA.
If sellers regain control and price closes below the recent support structure, 724.46 becomes a logical area to watch for another reaction.
713.97 — Secondary Downside Reference
If the next bearish move continues beyond the first objective, 713.97 becomes another important reference.
This would represent a more substantial continuation of the correction.
And below that, the larger weekly support becomes increasingly important.
703.59 — Major Weekly Support
This remains the upper boundary of the broader weekly support region we've been discussing.
If the correction develops the negative weekly momentum I expect, the market may eventually work toward this area.
And that's where I anticipate buyers becoming considerably more aggressive.
The lower rising 61.8% Fibonacci fan and broader weekly support zone could provide the foundation for a more meaningful recovery.
But the exact path and eventual destination will depend on the new bearish structure once it forms.
For now, 724.46 and 713.97 are provisional downside references, not confirmed targets from a pattern that doesn't yet exist.
🧭 What Happens Next
1️⃣ Can Buyers Defend 751.45–744.30?
This is the first major question.
Friday's candle confirmed the new bull flag and tested its support zone.
If buyers return early this week, the pattern has an opportunity to survive.
But another sharp decline into the zone, particularly with expanding bearish 4-hour momentum, would make me increasingly cautious.
2️⃣ Can SPY Break Above 763.04?
This is the bullish continuation trigger.
A sustained daily close above 763.04 would improve the outlook considerably.
It would indicate that buyers are successfully defending the new pattern and challenging the most recent high.
From there, the upside roadmap becomes:
771.29 → 775.90 → 781.78–782.24
But I want to see momentum confirm the move.
The weekly chart remains bearish, and a breakout without improving trend strength could quickly become another false start.
3️⃣ Does the 4-Hour Squeeze Turn More Negative?
This may be the first useful clue about which scenario is developing.
If negative 4-hour momentum expands while price remains beneath resistance, I'd expect renewed pressure on the bull flag's defense zone.
If the negative cycle remains shallow and buyers begin rebuilding strength, the bullish scenario remains viable.
4️⃣ Does the Weekly Squeeze Finally Roll Negative?
This is the bigger question.
If price weakness continues through the week and the weekly histogram turns negative, the bearish outlook becomes more convincing.
That would increase the probability that the new daily bull flag fails and that the market begins another move toward lower support.
But a weekly recovery that stabilizes the histogram could delay or weaken that bearish scenario.
5️⃣ Does SPY Retest the November Lows?
If the bull flag is invalidated, I'll begin watching 732.71 and the daily 200SMA for the next major decision.
A successful defense could create more consolidation.
A confirmed close below both would increase the probability of another bearish expansion.
At that point, the preliminary downside references at 724.46, 713.97, and eventually 703.59 become increasingly relevant.
🎯 Trading Strategy — Stay Flexible
This remains a difficult environment for traders who insist on maintaining one directional bias regardless of what the market is actually doing.
Last week demonstrated why.
SwingTraderPro identified the rebound opportunity near the lows.
Buyers then rallied hard enough to invalidate the developing bear flag.
But by Friday, sellers were already challenging the next bullish pattern.
The structure is changing faster than the higher-timeframe momentum can fully reset.
That's why I remain focused on short-duration opportunities and clear confirmation.
For intraday trading, our bullish and bearish scanners combined with ORBI remain particularly useful.
I want to identify stocks where multiple timeframes are aligned in the direction of the move currently developing.
That may mean trading bullish setups during a relief rally.
It may mean focusing on bearish opportunities when the 4-hour and daily momentum begin aligning lower again.
But I don't want to confuse a profitable short-term rebound with proof that the larger correction has ended.
The Weekly Watchlist also remains useful for monitoring current and former market leaders.
Many of those names may be experiencing similar whipsaw behavior.
Some could establish attractive bullish patterns if the market stabilizes.
Others may develop bearish continuation structures if selling resumes.
For longer-duration bearish opportunities, I remain interested in defined-risk option spreads when price rejects resistance and the expected move supports the structure.
But I'm not interested in chasing a decline simply because the larger outlook remains bearish.
Let price establish resistance. Let momentum confirm the direction. Then evaluate whether the trade offers an attractive risk-to-reward opportunity.
And given the potential for sharp reversals, I'm particularly interested in taking profits when the market provides them rather than assuming every move will continue uninterrupted.
⚠️ Don't Let the New Bull Flag Create False Confidence
This is the point I want to emphasize most heading into the week.
We have a technically valid daily bull flag.
Its anchors are established.
Its support zone is defined.
Its upside targets are measurable.
But none of that guarantees a bullish continuation.
The market has already demonstrated how quickly patterns can fail in the current environment.
And the broader indicators remain concerning.
The weekly chart is still favoring sellers.
The weekly Squeeze is approaching a potential bearish transition.
The 4-hour timeframe is already rotating back toward negative momentum.
And daily buyers have not yet established a convincing directional advantage.
So while I'll respect the active bull flag, I won't assume it deserves the same confidence as a bullish pattern developing within a healthy, strengthening weekly uptrend.
Context determines how much weight we should place on a pattern.
And right now, that context argues for caution.
If the bulls want to change the outlook, they need to prove they can defend support and reclaim resistance.
Until then, I'm remaining skeptical of another sustained rally.
🎯 Bottom Line
Last week was one of the clearest examples we've had of how quickly market structure can change during a correction.
The previous Friday, SwingTraderPro identified a potential rebound near the lows.
Monday delivered that rebound, reaching the first two retracement targets of the developing bearish pattern.
Tuesday consolidated.
Wednesday's stronger-than-expected rally invalidated the bear flag.
Thursday established another high.
And Friday produced the lower high and lower low needed to confirm a new daily bull flag.
The active pattern is now bullish. The larger momentum outlook remains cautious to bearish.
Our key structural levels are:
744.30–751.45 — New Bull Flag Defense Zone
749.53 — Weekly Breakout Support
763.04 — Bull Flag Resistance / Continuation Trigger
771.29 — Bull Flag Target 1
781.78 — Bull Flag Target 2
782.24 — Weekly Target 1
If buyers defend support and break above 763.04, a move toward the established upside targets becomes possible.
But if price begins the week moving lower while 4-hour bearish momentum strengthens and the weekly Squeeze transitions negative, I expect the new bull flag may be invalidated almost as quickly as the previous bear flag was.
That would shift our attention back toward:
732.71 — November Low Anchor / Major Support
Daily 200SMA — Critical Long-Term Moving-Average Reference
And, if those levels fail:
724.46 → 713.97 → 703.59
Those remain provisional downside references until a new bearish pattern forms and provides more precise Fibonacci targets.
My expectation remains that another move lower is the more likely outcome unless bulls establish meaningful strength early in the week.
But last week was a useful reminder that the market doesn't owe us a clean directional trend.
The bulls have a valid pattern. The bears still have the momentum backdrop.
And whichever side wins the battle around the current support and resistance structure will determine what comes next.
Stay nimble.
Respect the pattern that's actually active.
Don't become attached to yesterday's directional thesis.
Let price confirm the move, let momentum establish its strength, and trade the setup rather than the prediction.
