
SPY Pullback Nears Critical Bull Flag Support

📆 DAILY CHART OUTLOOK — SPY
Week of October 19, 2026
Last week was an important change in the daily market structure.
For months, we've been watching ADX steadily decline as SPY continued consolidating beneath resistance. Going into last week, daily ADX had fallen below 10, an exceptionally weak reading that told us there was very little trend strength behind the market's recent advance.
We were hoping the breakout above 776.85 would finally produce the momentum needed to carry SPY toward our weekly target at 782.24 and eventually the major daily target at 789.84.
That isn't what happened.
Instead, sellers took control Monday, and by Friday afternoon, a bearish flag that had developed on the lower timeframes broke down and reached its first target.
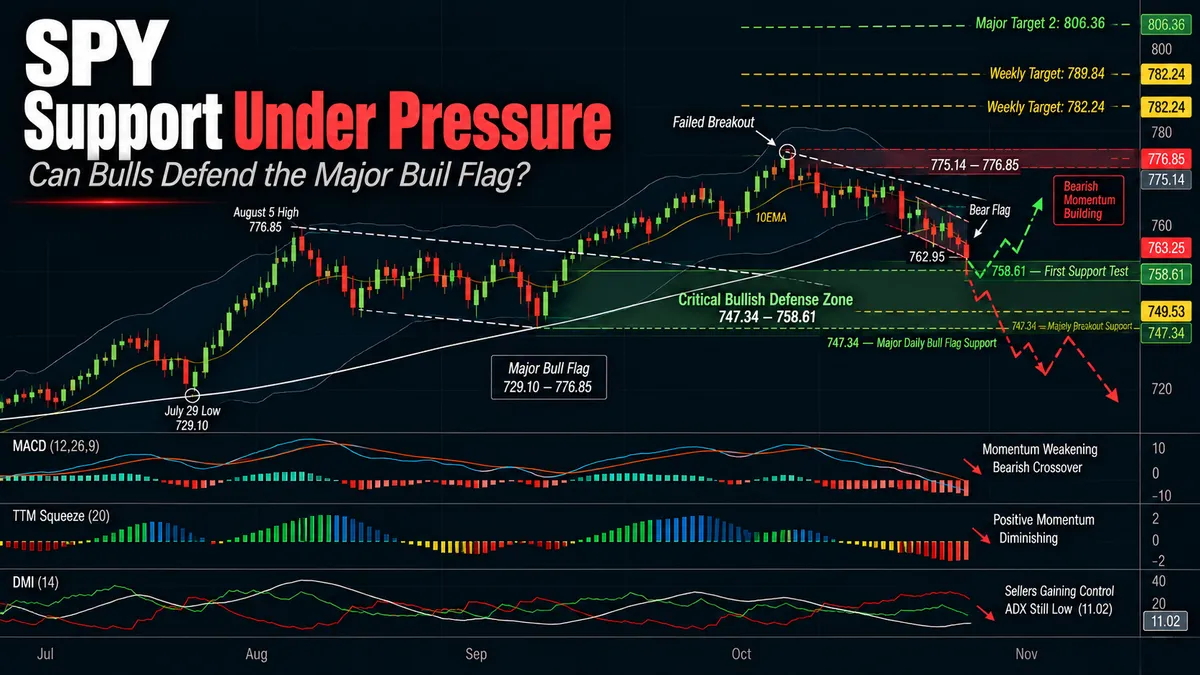
Now SPY is approaching a critical support area where several important technical levels converge.
The major daily bull flag remains intact, but the recent breakout has failed to hold.
And with momentum beginning to shift in favor of sellers, I think there's a very real possibility that the market needs a deeper retracement before buyers can rebuild the strength required for another sustained move higher.
The question now becomes:
Can bulls defend the major daily support zone, or will this pullback develop into something larger?
⸻
📌 Pattern State
Pattern State: Bull Flag Active
Pattern Start: 729.10 (7/29 low)
Low Anchor: 729.10 (7/29 low)
High Anchor: 776.85 (8/5 high)
Active Bull Flag Levels
0% Support: 729.10
38.2% Flag Support: 747.34
61.8% Flag Support: 758.61
100% Resistance: 776.85
127.2% Target 1: 789.84
161.8% Target 2: 806.36
Pattern Confirmation: Bull flag established on 8/6.
Current Mode: Bull flag remains active, but the recent breakout above 776.85 has failed to hold. Price is retracing toward the major bullish defense zone while bearish momentum develops on the lower timeframes.
Bullish Defense Zone: 747.34–758.61
Immediate Support: 758.61, followed by the 749.53 weekly breakout level and 747.34 daily flag support.
Structural Invalidation: A daily close below 747.34 would invalidate the active major bull flag and signal that the market may be transitioning into a deeper bearish structure.
⸻
🔄 Structural Sequence — What Happened Last Week
1️⃣ Monday — Sellers Take Control
Monday opened relatively flat, but buyers couldn't generate the continuation we had been hoping for.
Instead, sellers stepped in and began pushing SPY lower.
This was the first sign that the previous week's breakout might not have enough momentum behind it to carry price through the resistance zone overhead.
Remember, ADX was already below 10.
The market had broken resistance, but the strength needed to sustain that move never really developed.
⸻
2️⃣ Tuesday — The Breakout Comes Under Pressure
Tuesday opened lower, and selling continued.
Buyers eventually found some support beneath the previous 776.85 resistance level, but the recovery wasn't particularly convincing.
More importantly, ADX continued declining.
That was the problem.
We needed to see trend strength return following the breakout.
Instead, price was falling back into the previous consolidation while the underlying trend remained exceptionally weak.
The continuation we had been waiting for simply wasn't materializing.
⸻
3️⃣ Wednesday — Lower-Timeframe Bear Flag Begins Forming
Wednesday gapped lower, opening beneath the previous breakout resistance.
Sellers remained in control throughout much of the session before buyers managed a modest recovery into the close.
But something more important was developing beneath the daily chart.
On the 30-minute and 1-hour timeframes, price began establishing a bearish flag structure.
Following the initial selloff, SPY started consolidating and retracing higher inside a rising channel.
That gave us a new lower-timeframe pattern to monitor.
Unlike the smaller patterns that had been appearing and disappearing during the previous weeks, this one began establishing a clearer bearish continuation structure.
⸻
4️⃣ Thursday — Bear Flag Retests Resistance
Thursday opened lower again, pushing SPY back toward Wednesday's lows.
Buyers stepped in and produced a recovery.
But that rally carried price directly toward the developing lower-timeframe bear flag's defense area, around 771.98.
That was an important distinction.
On the daily chart, Thursday's rally might have looked like buyers trying to regain control.
On the hourly chart, however, price was simply retracing into resistance within a developing bearish continuation pattern.
The question became whether buyers could break that structure or whether sellers would defend it and resume the move lower.
⸻
5️⃣ Friday — Bear Flag Breaks Down
Friday gave us the answer.
After failing to extend Thursday's recovery, sellers regained control.
By the early afternoon, SPY broke below the lower-timeframe bear flag and accelerated lower.
The breakdown carried price through the established 766.71 breakdown level and into the first bearish target at approximately 762.95.
Bear Flag Target 1: 762.95 — Reached
Buyers appeared around that area, but the recovery wasn't enough to reverse the broader selling pressure.
SPY finished the session at 763.25, well below the daily 10EMA.
Friday's low reached 760.64.
And that leaves us heading into the new week with price approaching the major daily support structure.
⸻
📉 The Lower-Timeframe Bear Flag Remains Important
The hourly chart gives us a clearer picture of how the selling developed.
After Wednesday's initial decline, SPY established a rising bearish consolidation.
Thursday's recovery carried price back into the flag's defense zone.
Friday then confirmed the bearish continuation with a breakdown.
The important levels established by that intraday structure were:
771.98 — Lower-Timeframe Resistance Reference
766.71 — Bear Flag Breakdown Level
762.95 — Bear Flag Target 1 — Reached
The first target has now been achieved.
But that doesn't necessarily mean the selling is finished.
The larger directional objective remains the major daily bull flag's defense zone, where several important support references are converging.
That's where my attention is shifting.
The hourly bear flag is useful for understanding the immediate bearish move, but it does not replace the major daily bull flag as our primary pattern.
The major daily structure remains active until its own invalidation conditions are met.
⸻
📐 Immediate Structure Map
The daily chart has several important levels directly beneath current prices.
And the next meaningful decision is likely to occur around them.
758.61 — Major Daily Flag Support
This is the upper boundary of our established bullish defense zone.
It's also positioned near the area where the rising weekly trendline and daily moving-average support are becoming increasingly relevant.
That makes the area around 758.61 an important first test.
If buyers step in and defend it, the larger bull flag can remain intact without requiring a deeper retracement.
But if selling continues through that area, the next major support cluster comes into focus.
⸻
749.53 — Weekly Breakout Support
This remains one of the most important higher-timeframe levels on the chart.
SPY broke above 749.53 during the first week of August.
Since then, that level has served as the foundation for the entire consolidation and advance that followed.
A retracement toward 749.53 would bring SPY back to the breakout structure we've been following for more than two months.
That would be a meaningful test.
And sitting almost directly beneath it is the daily bull flag's structural support.
⸻
747.34 — Major Daily Bull Flag Support
This is the level that ultimately determines whether the major daily bull flag remains valid.
As long as price continues holding above 747.34, the larger bullish pattern remains intact.
A daily close below it would change the outlook materially.
At that point, I would no longer be looking at the current decline as simply another pullback within the existing bull flag.
I'd begin expecting a new bearish structure to develop, potentially setting up a move toward the daily 200SMA.
That's where I would expect buyers to make another meaningful attempt at rebuilding the larger uptrend.
But first, the market has to show us whether the support directly ahead can hold.
⸻
🔍 Daily Momentum — The Picture Is Changing
This is where the daily chart becomes considerably more interesting.
For months, the primary momentum problem was the absence of trend strength.
ADX kept falling.
Price continued consolidating.
Neither side could generate a sustained directional move.
Now we're beginning to see that environment change.
But not necessarily in the direction bulls were hoping for.
ADX — Trend Strength Is Finally Beginning to Rise
Daily ADX had fallen below 10 going into last week.
By Friday's close, it had begun turning higher again.
Current ADX: Approximately 11.02
That's still an extremely low reading.
But the direction of the change matters.
For weeks, ADX was declining while price struggled to establish a meaningful trend.
Now it's beginning to rise as sellers take control.
That raises the possibility that the next period of trend expansion could initially favor the downside.
We don't have enough strength yet to call this a powerful bearish trend.
But it's the first meaningful warning that the market may be transitioning out of the previous low-volatility consolidation.
⸻
DMI — Sellers Take the Advantage
DMI has also changed.
DI- has crossed above DI+.
And by Friday's close, the directional readings had separated noticeably:
DI-: Approximately 32.60
DI+: Approximately 19.93
That is a meaningful shift.
For much of the recent consolidation, bulls maintained at least a modest directional advantage.
Now sellers have taken control.
And with ADX beginning to rise, the combination is becoming more concerning.
If DI- continues expanding while ADX rises, it would strengthen the case for a deeper retracement into the daily defense zone.
If buyers defend support and DI+ begins recovering, that could signal the bearish move is losing momentum.
⸻
MACD — Bearish Cross While Still Above Zero
MACD is also shifting.
The lines are crossing bearishly, although they remain above the zero line.
That's an important distinction.
The positive position relative to zero reflects the larger bullish momentum backdrop, but the bearish cross warns that shorter-term momentum is deteriorating.
If MACD continues weakening and eventually moves below zero, the evidence for a more substantial correction would increase.
For now, it adds to the growing collection of warnings suggesting the market may need more time before another sustainable advance develops.
⸻
TTM Squeeze — Watch the Next Negative Histogram
The TTM Squeeze histogram is also beginning to roll over.
Positive momentum has been fading, and the histogram appears positioned to transition into negative territory if selling continues.
This is another development I'm watching closely.
But the important question isn't simply whether the histogram turns negative.
It's how negative the next move becomes compared with the previous negative momentum cycle.
If the histogram produces deeper negative readings than the previous downswing, that would suggest bearish momentum is expanding.
Combined with rising ADX and DI- remaining above DI+, that would make a breakdown through the major daily support zone much more concerning.
On the other hand, if price tests support while the negative histogram remains relatively shallow compared with the previous downswing, that could indicate sellers are losing momentum.
That would make me more interested in the possibility of buyers defending the larger bull flag.
The histogram's behavior around support could provide an important clue about whether this is another temporary pullback or the beginning of a more significant bearish move.
⸻
⚠️ The Major Bull Flag Is Approaching Its Most Important Test
We've followed this major daily bull flag since August.
And despite all the consolidation, failed minor patterns, and uneven momentum, the larger structure has remained intact.
That is still true today.
But the current pullback is different from some of the smaller reversals we've experienced recently.
We now have:
a failed continuation above 776.85
a confirmed bearish flag breakdown on the lower timeframes
price below the daily 10EMA
DI- crossing above DI+
ADX beginning to rise after months of declining trend strength
MACD crossing bearishly
a TTM Squeeze histogram threatening to turn negative
Individually, none of those conditions guarantees a deeper correction.
Together, they make the support zone immediately beneath price considerably more important.
The bulls are approaching an area they need to defend.
And this week could tell us whether they're ready to do it.
⸻
🧭 What Happens Next
1️⃣ Does the 758.61 Support Area Hold?
This is the first test.
The lower-timeframe bear flag has already reached its initial target, but its broader bearish objective points toward the daily support structure.
The 758.61 area, together with nearby trendline and moving-average support, is where I'd begin watching closely for signs of buyers stepping in.
Given how extended the recent selling became on the hourly chart, I wouldn't be surprised to see a reaction there.
But a reaction and a sustained reversal are two different things.
We need to see whether buyers can actually defend the area and begin rebuilding a bullish structure.
⸻
2️⃣ Does SPY Retest 749.53–747.34?
If the first support area fails, the next meaningful test becomes:
749.53 — Weekly Breakout Support
747.34 — Major Daily Bull Flag Support
These levels are close enough that I view them as a critical higher-timeframe support cluster.
A successful defense could provide the foundation for another period of consolidation and eventually another attempt higher.
But a daily close below 747.34 would invalidate the active daily bull flag.
That would force a meaningful change to the roadmap.
⸻
3️⃣ What Happens if the Major Bull Flag Breaks?
If SPY loses both the weekly breakout level and the major daily flag support, I would expect the market to begin developing a new bearish structure.
Most likely, that means another bear flag eventually forms on the daily chart.
That new pattern would then become our primary roadmap.
And the next major downside area I'd be watching would be the daily 200SMA.
That's where I would expect buyers to become much more interested in stepping back into the market.
A move toward the 200SMA would represent a much more meaningful correction than the shallow pullbacks we've been experiencing throughout the summer.
But it could also provide the reset the market needs before another larger advance.
⸻
4️⃣ What if Buyers Defend Support?
This is still a very realistic possibility.
If SPY holds the major daily defense zone, I would expect more consolidation rather than necessarily an immediate breakout.
The market has spent months struggling to establish meaningful trend strength.
And after last week's selloff, I don't think we should assume buyers will simply step in and carry SPY directly back toward the highs.
More sideways price action may be exactly what's needed.
That could allow:
sellers to finish the current move
buyers to establish support
momentum to stabilize
another Squeeze to develop
volatility to compress before the next expansion
If that happens, I would eventually expect the market to make another attempt at the resistance levels overhead.
775.14 — Previous Minor Resistance
776.85 — Major Bull Flag Resistance
779.81 — Previous Minor Target 1
782.24 — Weekly Target 1
785.75 — Previous Minor Target 2
789.84 — Major Daily Target 1
Those levels remain relevant as long as the larger bullish pattern survives.
⸻
🎯 Intraday Trading Plan
For now, I think the best opportunities remain on the lower timeframes.
We're entering a period where sellers may still be completing the initial move lower while buyers are beginning to look for an attractive place to step back into the market.
That can create substantial back-and-forth price action around support.
And that isn't necessarily the environment where I want to force a directional swing thesis.
Instead, I'm staying focused on the bullish and bearish scanners and looking for opportunities through ORBI.
The objective is straightforward.
When the market is moving lower, focus on the tickers with the strongest bearish alignment across multiple timeframes.
When buyers take control, focus on the tickers with the strongest bullish alignment.
That means paying particular attention to names where the:
15-minute → 30-minute → 1-hour → higher timeframes
are aligned in the same direction.
Those are the names most likely to provide cleaner directional opportunities when momentum develops.
With the market approaching major support, I also want to remain mindful of sharp reversals.
The stronger intraday moves may come from both directions as sellers take profits and buyers attempt to establish a bottom.
So rather than trying to predict every turn in SPY:
Follow the direction that's actually developing, trade the strongest aligned names, and focus on capturing the shorter intraday moves.
There's no need to guess.
And there's no need to force a swing trade while the larger market is still deciding where support belongs.
⸻
🎯 Bottom Line
The daily chart has changed meaningfully over the past week.
After breaking above 776.85 two weeks ago, SPY failed to generate the trend strength needed to sustain its continuation.
Last week, the breakout failed to hold, and sellers regained control.
The lower-timeframe bear flag that developed Wednesday and Thursday broke down Friday and reached its first target near 762.95.
Now price is approaching the major daily support structure.
Our primary pattern remains:
Pattern State: Bull Flag Active
Pattern Start: 729.10
Low Anchor: 729.10
High Anchor: 776.85
Bullish Defense Zone: 747.34–758.61
Structural Invalidation: Daily close below 747.34
Major Target 1: 789.84
Major Target 2: 806.36
The immediate support roadmap is:
758.61 → 749.53 → 747.34
And the momentum picture is becoming increasingly important.
ADX has finally begun rising after months of declining trend strength, but sellers currently have the directional advantage.
DI- has crossed above DI+.
MACD is crossing bearishly while still above zero.
And the TTM Squeeze histogram is threatening to turn negative.
That combination tells me a deeper correction is very much in play.
If SPY holds the major bullish defense zone, I expect more consolidation as buyers and sellers work through the current imbalance.
That could ultimately produce another Squeeze and the volatility expansion needed to resume the larger uptrend.
But if price loses 749.53 and 747.34, I would expect a new bearish structure to develop, potentially guiding SPY toward the daily 200SMA before buyers attempt to rebuild the trend again.
Either way, we're approaching an important decision point.
The next meaningful move will likely be determined by how buyers respond to the support directly beneath us.
Until that becomes clearer, I'm keeping my attention on intraday opportunities.
The bullish and bearish scanners, combined with ORBI and strong multi-timeframe alignment, remain the best way to approach a market that may be entering another volatile period of consolidation.
The longer-term bullish outlook hasn't necessarily changed.
But the market may need a more meaningful reset before it's ready to continue higher.
For now, let the market establish support, let momentum reveal the direction, and trade the setups that actually confirm.
